
The global economy's new engine: Why Emerging Markets are now indispensable
Emerging Markets now drive nearly half of global GDP, yet they remain significantly underrepresented in most investment portfolios. This analysis explores the shifting pillars of growth that make a strategic allocation to these high-velocity regions a modern necessity.

Emerging Markets (EM) have been overshadowed by the dominance of the US market for more than ten years. While these regions have grown to represent nearly half of the world’s GDP1, as indicated by the graph below, they remain only 11% of global equity benchmarks2—a staggering disconnect between economic reality and investor allocation.
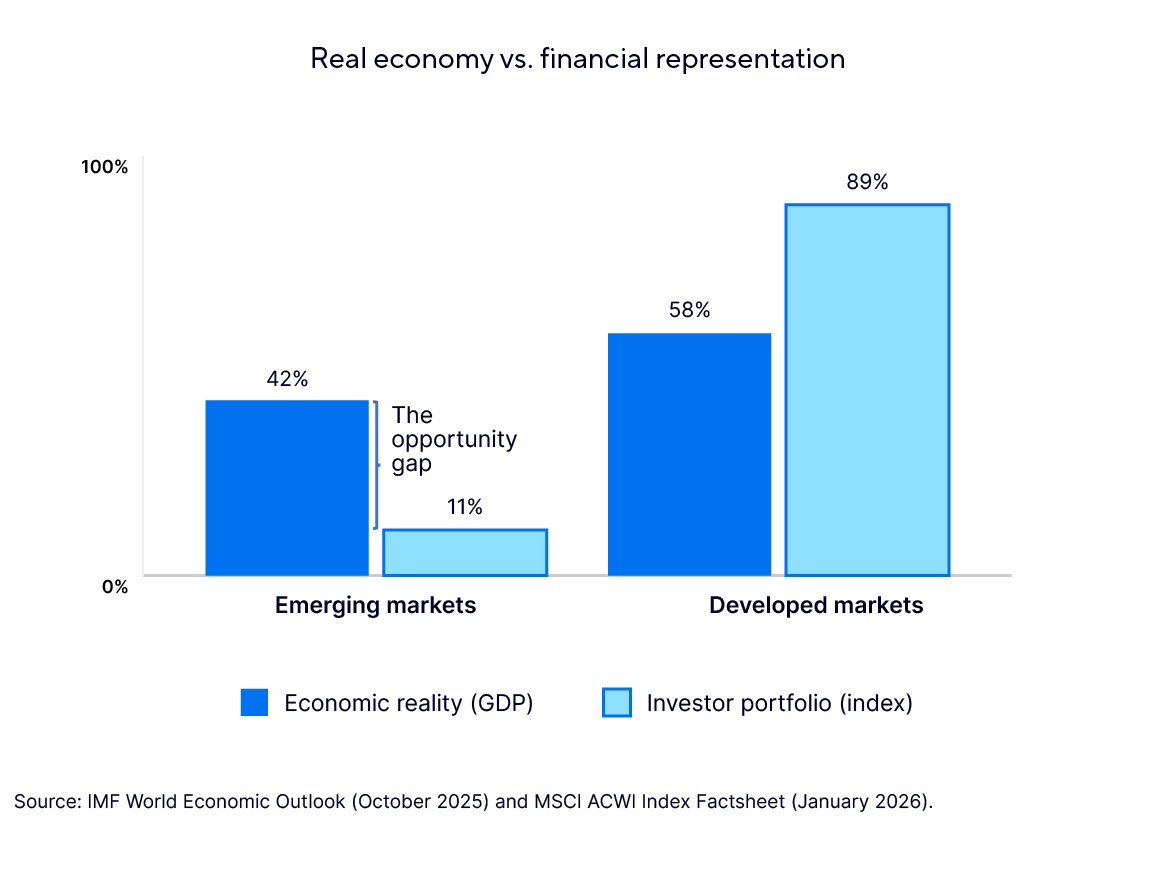
Figure 1: The Opportunity Gap: While Emerging Markets drive nearly half of global economic output, they remain significantly under-represented in global investment benchmarks.
However, 2025 marked a definitive break in that trend, with EM equities returning 34%3 and handily outperforming US benchmarks. We connected with our sub-advisor Driehaus Capital Management to gain perspective on this trend. Driehaus believes we are entering the early stages of a durable, multi-year outperformance cycle. It isn’t just about size; it’s about velocity.
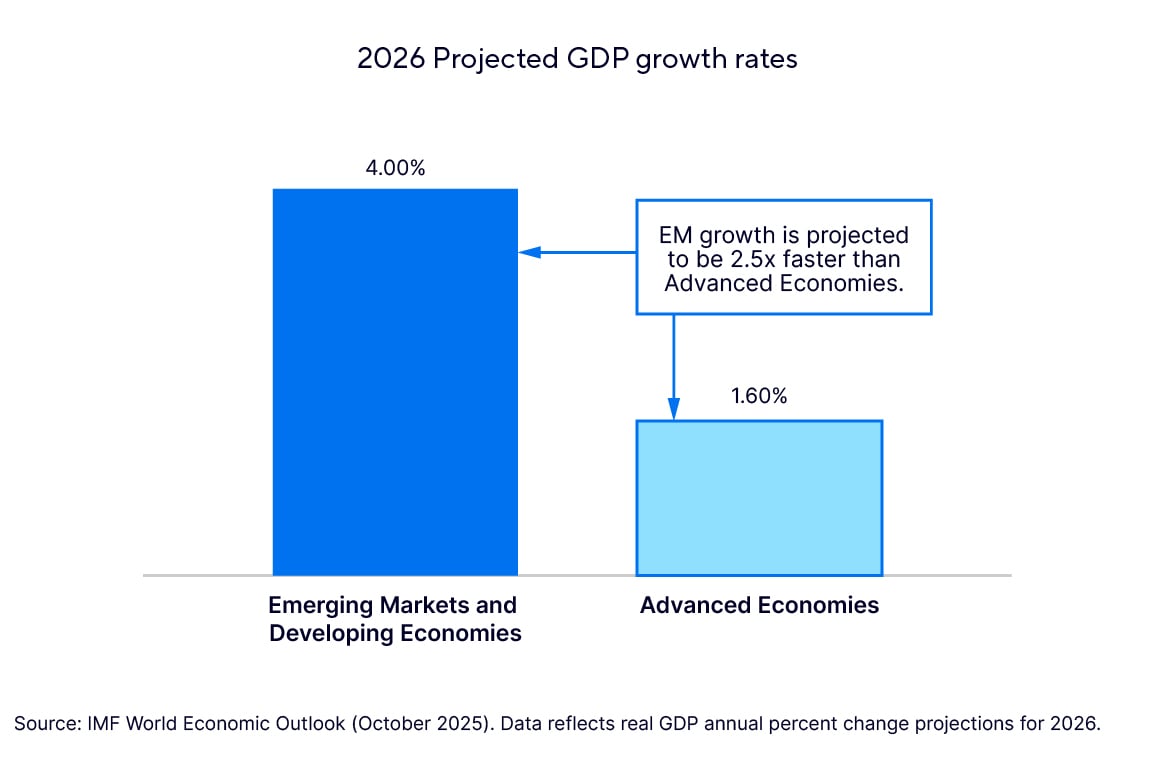
Figure 2: Superior Velocity: While global growth remains steady, the "engine" is lopsided. Emerging Markets are projected to grow at 4.0% in 2026—more than double the 1.6% rate expected for advanced nations like the US and Europe.
With projected GDP growth of 4.2%—more than double the rate of advanced economies1—Emerging Markets have transitioned from a peripheral 'alternative' to the global economy’s primary growth engine.
Their rationale for investing in Emerging Markets is currently driven by three fundamental pillars: dollar diversification, macro heterogeneity, and accelerating corporate profits.
1. The currency tailwind: Breaking the dollar’s gravity
Driehaus maintains that the trajectory of the US dollar is of "paramount importance." After 2025 saw one of the weakest years for the dollar on record, conventional currency valuation frameworks suggest it remains significantly overvalued.
- A compounding effect: As EM central banks—who normalized policy much earlier than the West—continue to show fiscal discipline, the dollar’s long-standing dominance is fading. A softening dollar lowers debt costs for EM nations and attracts global capital flows. This creates a compounding effect, where improving currency strength and increased investment capital work together to drive the total returns of EM equities over the long term.
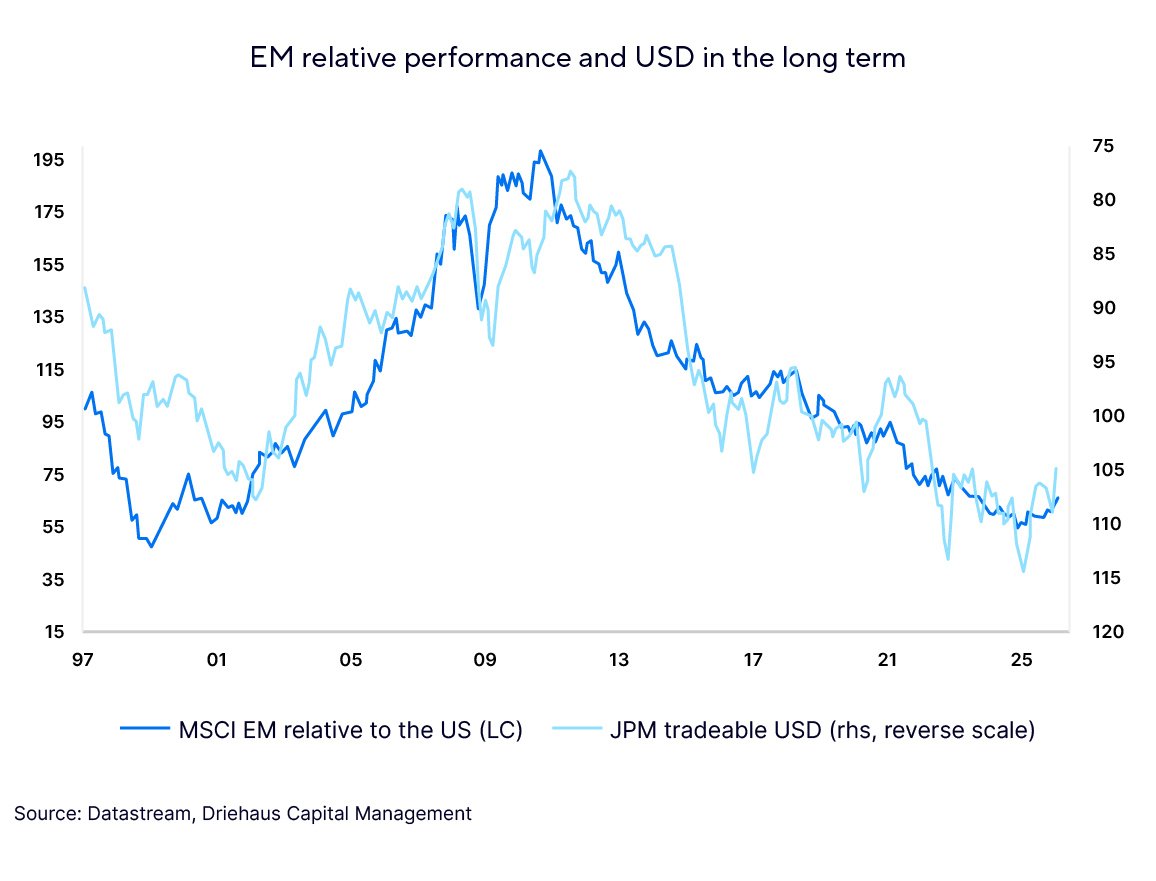
Figure 3: Historical Inverse Relationship: Periods of US Dollar stabilization or softening have historically acted as a primary catalyst for Emerging Market outperformance.
2. Strength in diversity: Beyond a market monolith
Unlike many developed markets, EM does not move as a single, uniform entity. Driehaus highlights this "heterogeneity" as a distinctly positive feature, not a bug.
- Alpha in dispersion: EM spans 24 countries with distinct cycles. In 2026, while half of these economies are expected to cut interest rates, others are holding steady or tightening.3
- Specialized hubs: This diversity allows for a "something for everyone" strategy. North Asian markets like Taiwan and Korea serve as the global foundry for AI hardware; meanwhile, Brazil and Chile provide the strategic natural resources (copper and lithium) essential for the energy transition.
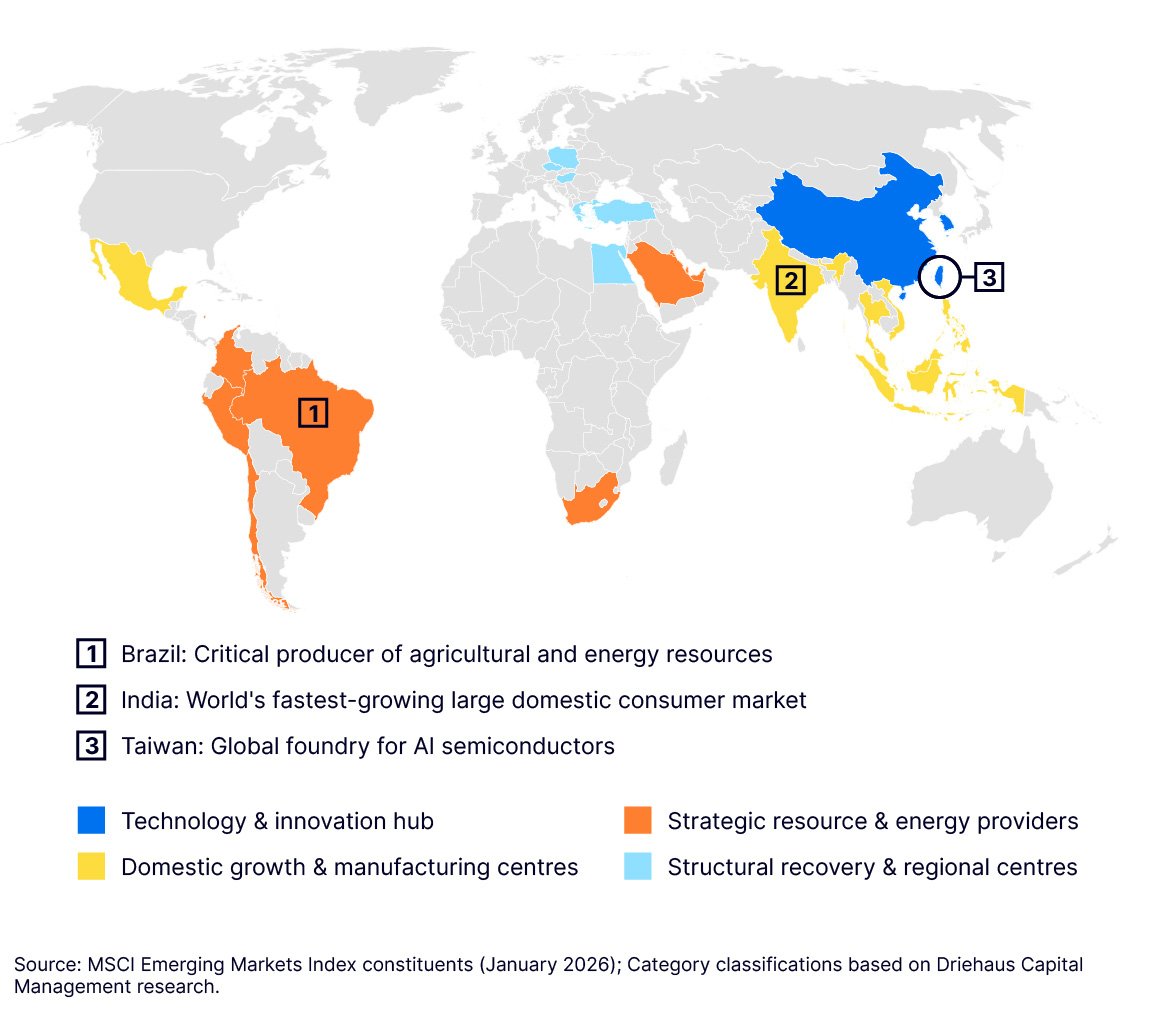
Figure 4: Beyond the Monolith: Today’s Emerging Markets are a diverse collection of specialized economies, from North Asian technology foundries to South American energy transition hubs.
3. The earnings supercycle: A leading 18% growth rate
The most powerful pillar of the "new engine" is a strengthening corporate earnings outlook, which provides the fundamental support for higher valuations.
- The global leader: Consensus forecasts for 2026 project EM earnings to grow at 18%—the fastest across all major global regions, outstripping the US (14%) and Europe (11%).4
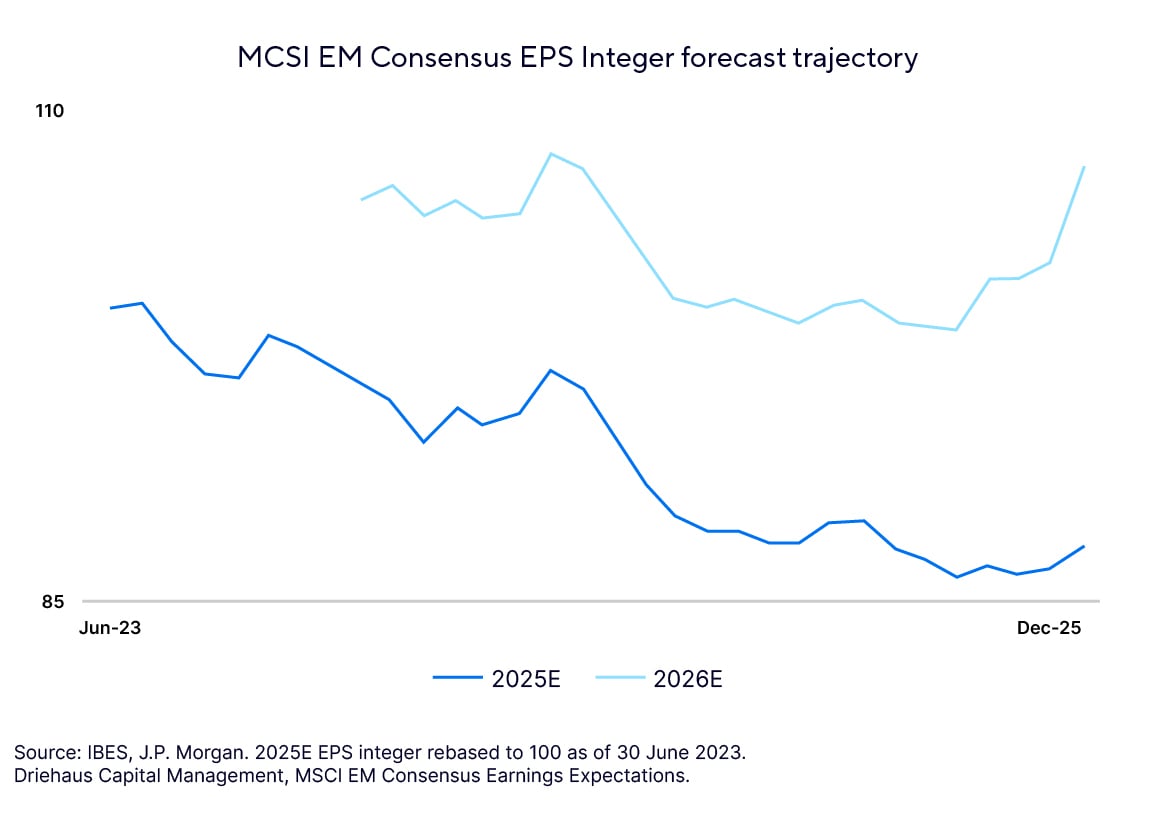
Figure 5: Growth Leadership: Consensus estimates project Emerging Market corporate earnings to grow by 18% in 2026, the highest anticipated rate among all major global regions.
- The AI/memory inflection: Technology now accounts for nearly 30% of the MSCI EM Index. As the world enters a "memory supercycle" driven by AI compute demand, leading EM producers are lifting earnings expectations to record highs.
The final catalyst: A potential shift in global capital
Perhaps the most compelling reason EM is now "indispensable" is the current state of market positioning. Global mutual fund allocations to EM stand at roughly half of their benchmark weighting. Should asset allocators simply move toward an "equal weight" position, it would represent a significant structural shift in global capital flows back into the asset class.3
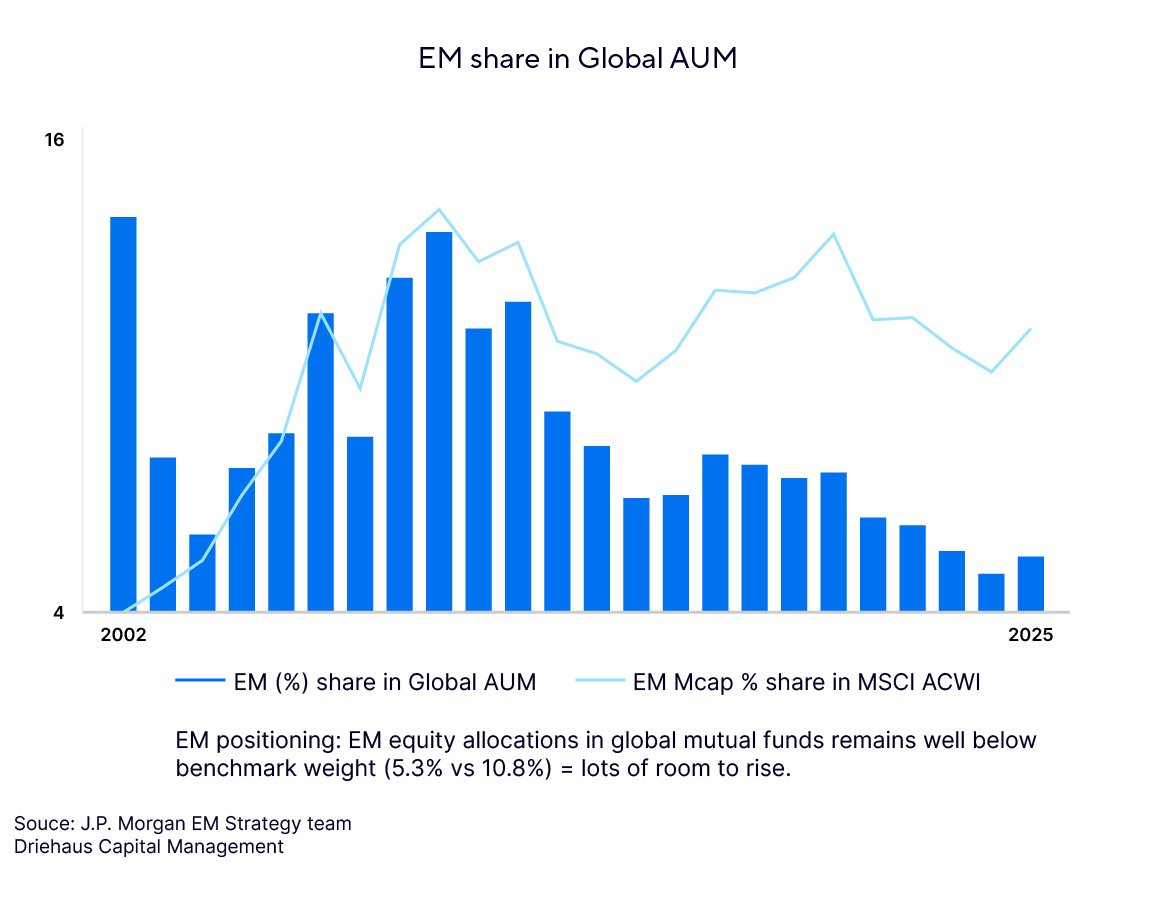
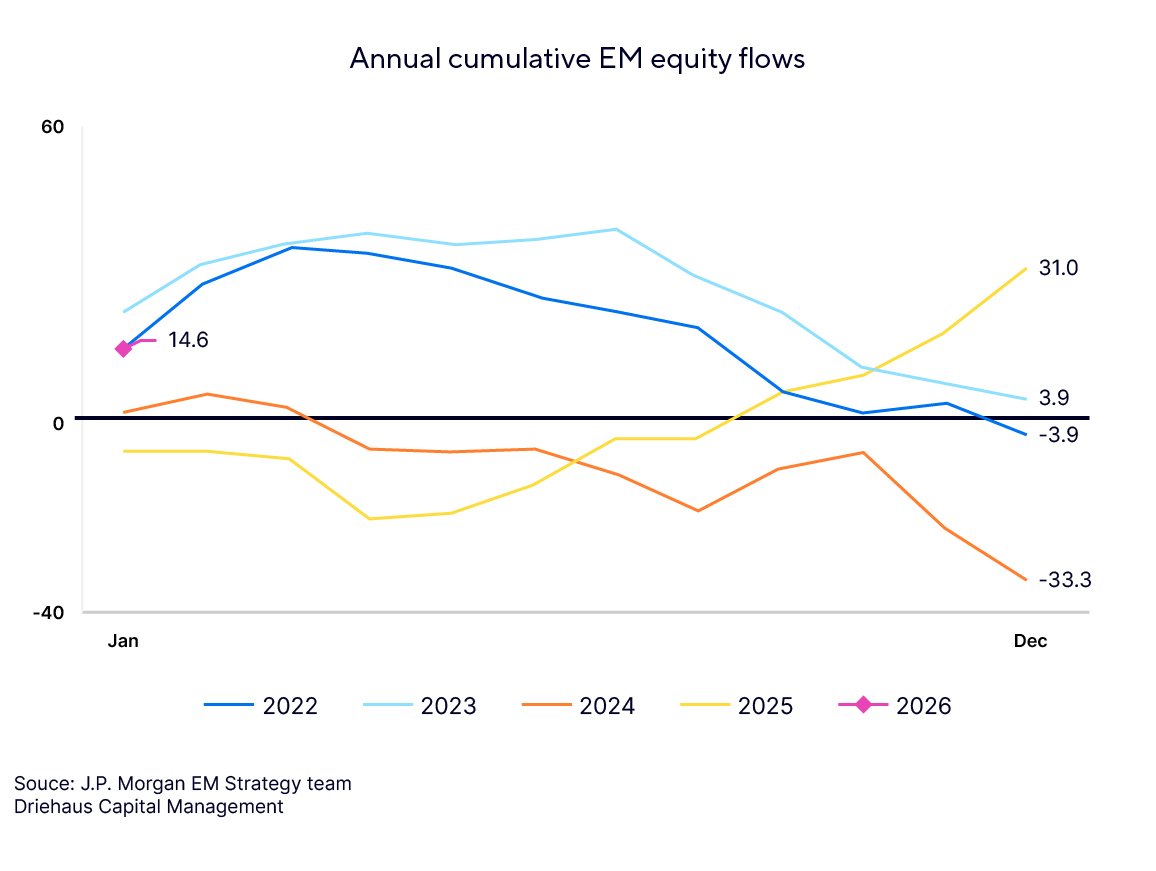
Figures 6 and 7: Global investor positioning in Emerging Markets remains near historical lows; a move toward a neutral benchmark weight would represent a massive shift in global capital.
As valuations remain at a significant discount and the alpha-rich environment continues to expand, the ATB Emerging Markets Equity Fund, an underlying exposure offered in ATB portfolio solutions, is specifically designed to capture this historic transition. By partnering with specialist sub-advisors like Driehaus, we provide our investors with active, institutional-grade exposure to these high-velocity markets.
The ATB Emerging Markets Equity Fund serves as a critical growth engine within our broader managed solutions:
- ATB Global Equity Pool: For those building custom portfolios, this fund provides the precise "tilt" needed to capture international growth and diversification.
- Compass Balanced, Balanced Growth, Growth, and Maximum Growth Portfolios: In these all-in-one solutions, this fund acts as a vital component, helping to mitigate the risks of home-country bias while ensuring your portfolio participates in the global "compounding effect" we see taking hold today.
Whether held individually or as a cornerstone of a Compass Portfolio, our focus remains on providing a simplified path to broad-based opportunities. As the global engine shifts toward the East and South, ensuring investment portfolios are aligned with that momentum is no longer just an option—it’s a necessity for long-term compounding success.
1 IMF World Economic Outlook (October 2025). Emerging Market and Developing Economies projected 2026 GDP growth (4.2%) vs. Advanced Economies (1.8%).
2 MSCI Inc. (January 30, 2026). MSCI ACWI Index Factsheet. Emerging Markets (EM) currently comprise approximately 11% of the total index market capitalization.
3 Driehaus Capital Management. (January 2026). Perspectives on Emerging Markets. Based on MSCI consensus earnings expectations as of January 2026.
4 MSCI EM Consensus Earnings Expectations (January 2026). Regional earnings growth forecasts for FY2026.
5 MSCI Emerging Markets Index Factsheet (January 2026). Information Technology sector weight.
This report has been prepared by ATB Investment Management Inc. (ATBIM). ATBIM is registered as a portfolio manager across various Canadian securities commissions, with the Alberta Securities Commission (ASC) being its principal regulator. ATBIM is also registered as an investment fund manager and manages the ATB Funds. ATBIM is a wholly owned subsidiary of ATB Financial and is a licensed user of the registered trademark ATB Wealth.
Portions of the market analysis and technical data in this article were provided by Driehaus Capital Management, a specialized sub-advisor to ATB Investment Management Inc. Driehaus provides expert management for the emerging markets component of our ATB Funds. The information presented is for illustrative purposes and is not intended as a recommendation to buy or sell any specific security.
Past performance is not indicative of future results. Opinions, estimates, and projections contained herein are subject to change without notice and ATBIM does not undertake to provide updated information should a change occur. This information has been compiled or arrived at from sources believed reliable but no representation or warranty, expressed or implied, is made as to their accuracy or completeness. ATB Financial, ATBIM and ATB Securities Inc. do not accept any liability whatsoever for any losses arising from the use of this report or its contents.
This report is not, and should not be construed as an offer to sell or a solicitation of an offer to buy any investment. This report may not be reproduced in whole or in part; referred to in any manner whatsoever; nor may the information, opinions, and conclusions contained herein be referred to without the prior written consent of ATBIM.