
The monetization frontier: From bottlenecks to bottom lines
Q2 2026 IPM Economic & Market Summary

Most market commentary today is consumed by the noise of the moment—sticky inflation prints, geopolitical friction, and the month-to-month volatility of central bank watching. But if you step back and observe the actual flow of capital, a clearer, structural picture emerges.
We are witnessing a fundamental transition in the market. The historic, multi-billion-dollar capital expenditure cycle in technology is exiting the infrastructure phase. The question for the rest of 2026 is no longer about building the bottlenecks; it is about whether these massive investments can translate into clear, corporate bottom lines.
Here is how we see the landscape shaping up and how we are positioning your capital.
The economic reality: A world of divergence
The global economy is flat on the surface, but underneath, it is highly fragmented.
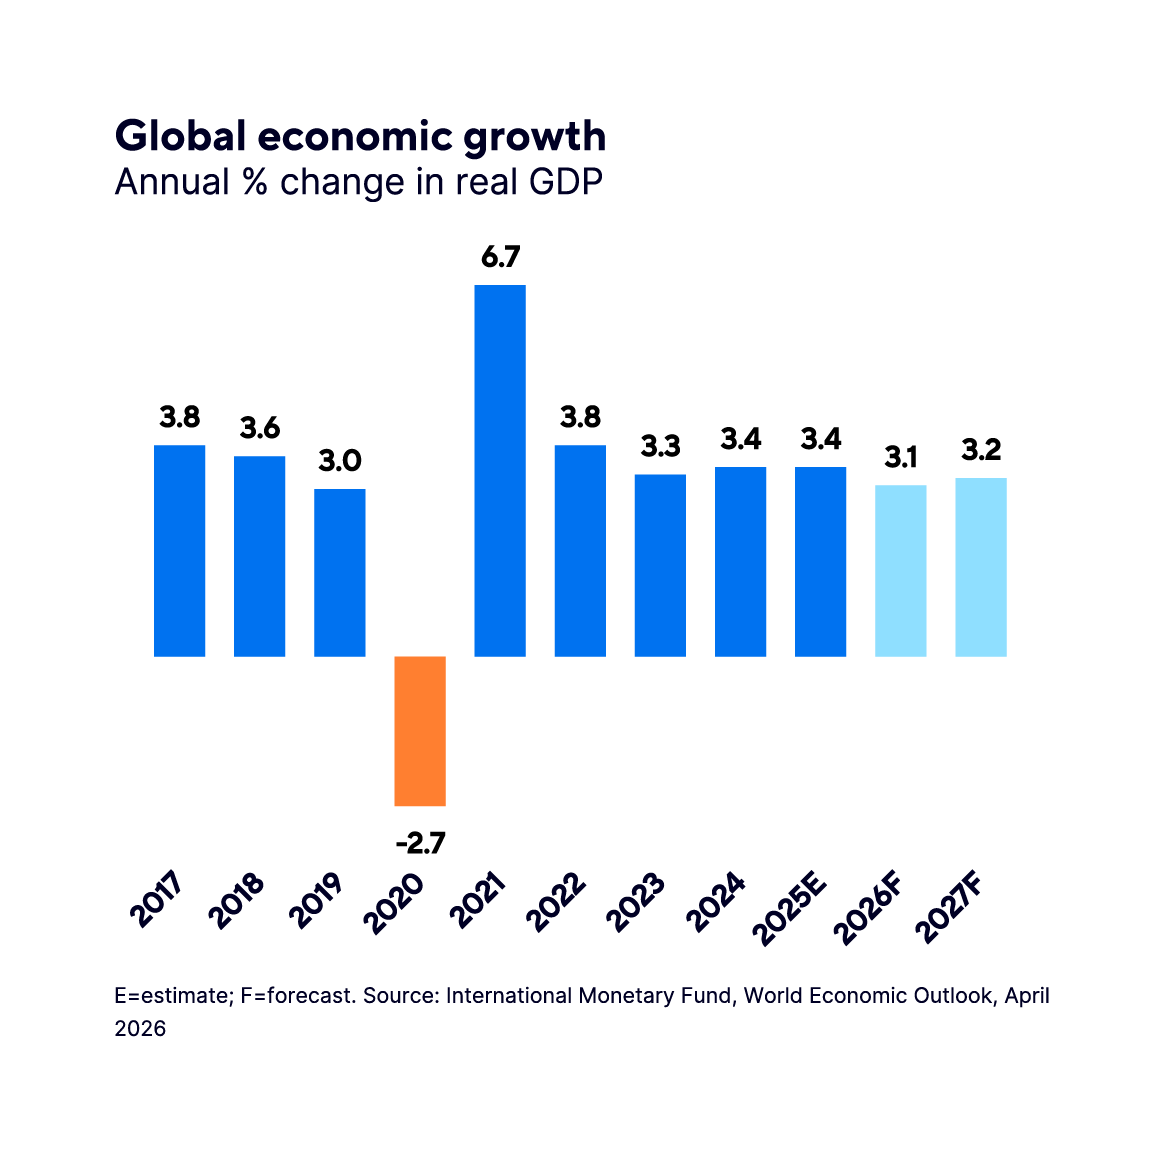
In the United States, we are seeing a shift from a consumer-driven economy to a corporate one. Real growth is anchored around 2%, but that headline number masks a stark divide. Corporate capital spending is booming, acting as a massive shock absorber against higher interest rates. Yet, the lower-income consumer is being squeezed. Real wages have dipped negative, and savings are a fraction of what they were prior to 2022. The US economy is currently floating on an expansionary fiscal deficit, but the consumer is carrying a heavy burden.
Here at home, the divide is geographical. The broader Canadian economy entered 2026 sluggishly. National growth is flat, productivity is lagging, and a pressured consumer will likely keep the Bank of Canada on the sidelines. However, if you look at Western Canada, the picture changes entirely. Alberta is operating in its own lane. Driven by an $84 oil baseline, a surge in migration, and new, durable investments in aviation and AI data centres, Alberta is projected to grow at 2.6%1 this year. We represent localized strength in an otherwise slow national economy.
Globally, the story is much the same. Europe is stalling under the weight of geopolitical and energy friction, slipping toward stagflation. Yet, we are seeing signs of pragmatic stabilization in key energy corridors. While the recent Israeli military strike caused a predictable blip in the headlines, the more consequential development is the newly signed Memorandum of Understanding (MOU) between the US and Iran aimed at keeping the Strait of Hormuz open. This signals that the major players are resolved to find a functional resolution and secure global trade routes. The diplomatic process will inevitably linger, but the acute tail risks in the region appear to be narrowing. Conversely, Asia is actively reaccelerating. We are tracking a massive, coordinated inventory restocking cycle in the East, which has placed a hard floor under global cyclical demand and quietly driven industrial metals up 16%2 this year.
Total returns in Canadian dollar terms:
|
Major Market Indices* |
Quarterly return |
YTD return |
|
S&P/TSX Composite Index |
6.96% |
11.17% |
|
S&P 500 Index |
17.12% |
14.07% |
|
MSCI EAFE Index |
12.66% |
13.28% |
|
FTSE Canada Universe Bond Index |
2.01% |
2.24% |
Source: Bloomberg, data as of June 30, 2026
The market reality: Paying for execution
US large-cap equities have run hard, but unlike previous speculative peaks, this rally has a foundation. Earnings expanded by a remarkable 28% in the first quarter. Many of the technology giants driving this market have disciplined balance sheets and generate so much cash that today’s higher interest rates do not significantly impact their debt loads.
However, we may be reaching the limits of ‘easy money’. The “token subsidy”—where software providers offer flat-fee AI access—is ending. As costs are passed down to the end-user, we believe it’s likely the market will rapidly separate the real enterprise winners from the speculative stories. We are no longer paying for the promise of the technology; we expect execution and cash flow.
In Canada, the equity market is doing exactly what we need it to do: act as a capital dampener. Record profitability in our major financial institutions, paired with structural resilience in the energy and materials sectors, continues to provide vital downside protection against global volatility.
Looking abroad: The reality of dividends
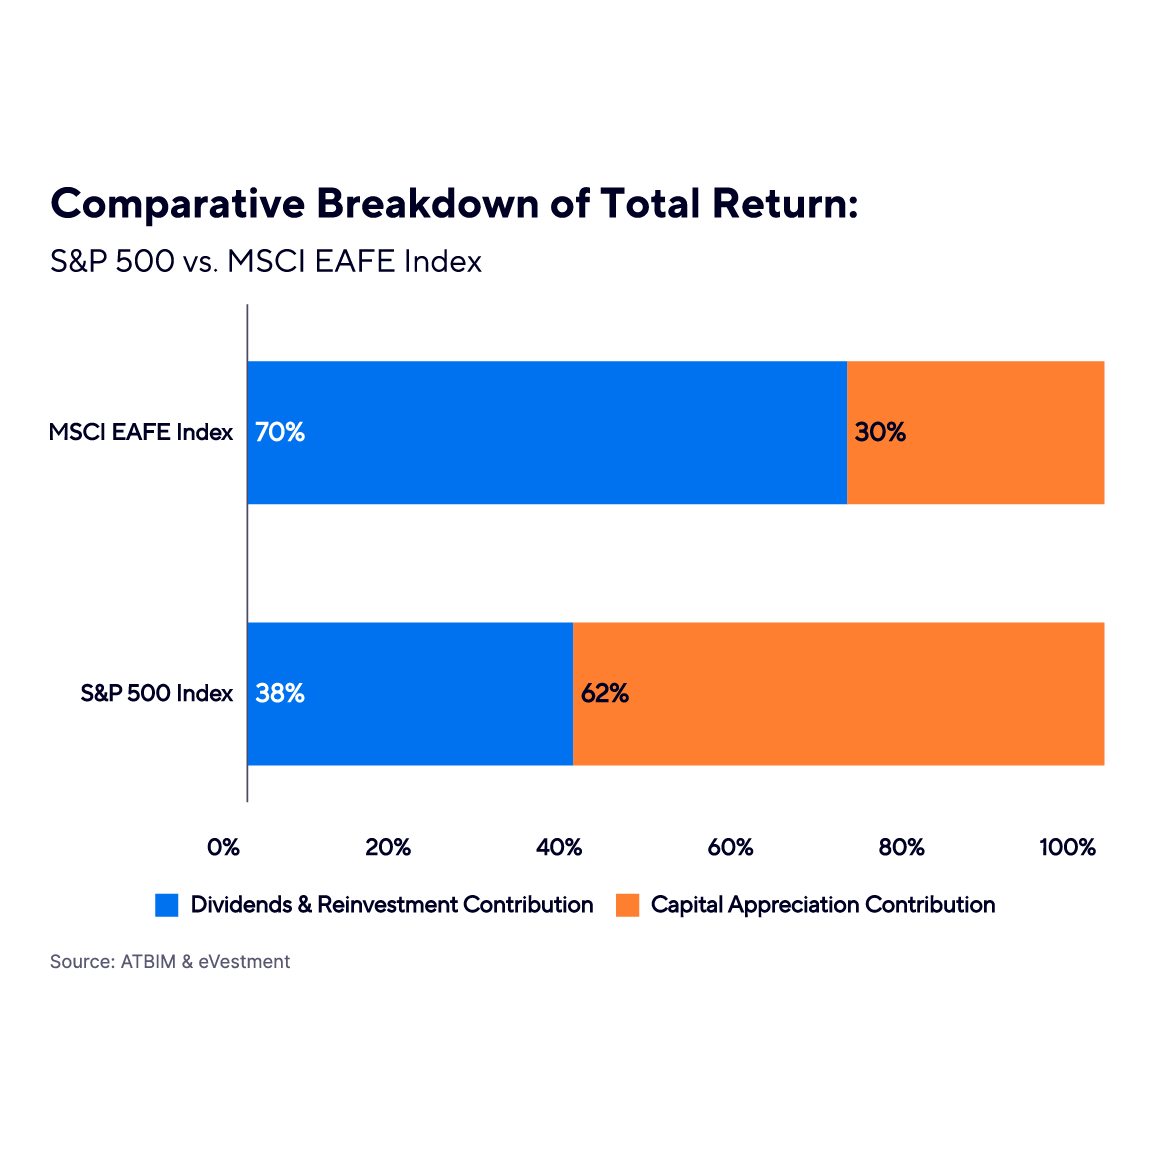
When we look at international developed markets (EAFE), valuations are sitting near the upper end of their 20-year historical ranges. You cannot buy the index today and simply hope for multiple expansion.
This is where market history is highly instructive. Over the last two decades, a staggering 70% of the total return in international markets came entirely from the collection and compounding of dividends (compared to just 38% in the US). Abroad, cash return to shareholders is the primary engine of wealth creation.
This reality dictates our allocation strategy. Within our international exposure, we utilize the Goldman Sachs Asset Management International Equity Income Strategy. They do not hug the index. Instead, they apply a private-equity mindset to public markets, holding a highly concentrated portfolio of 44 businesses. They underwrite companies with durable moats, pricing power, and an absolute commitment to dividend growth. It is a strategy built to capture upside while providing a hard floor of cash generation when macro conditions wobble.
Positioning your capital
Investing at this stage of the cycle requires holding two seemingly opposing truths: underlying corporate cash flows remain encouraging, but macro risks and index concentration demand a margin of safety.
Our current stance is best described as a highly disciplined bull. We choose to stay invested to capture the wealth-compounding velocity of this corporate expansion. However, we are actively buffering your portfolios. We are directing capital toward active equity managers who prioritize capital preservation and the ability to capture growth in unique ways. In fixed income, we are capturing attractive yields on the short-to-medium end of the curve without taking on the unnecessary risks of long-term bonds.
We are positioned to participate in the growth, but structured to protect your capital first.
1 ATB Economics
2 BCA Research
ATB Investment Management Inc. (ATBIM) is registered as a Portfolio Manager across various Canadian securities commissions with the Alberta Securities Commission (ASC) being its principal regulator. ATBIM is also registered as an Investment Fund Manager who manages the ATB Funds. ATBIM is a wholly owned subsidiary of ATB Financial and is a licensed user of the registered trademark ATB Wealth.
Past performance is not indicative of future results. The mutual fund performance data provided assumes reinvestment of distributions only and does not take into account sales, redemption, distribution or optional charges or income taxes payable by any security holder that may reduce returns. Unit values of mutual funds will fluctuate and past performance may not be repeated. Mutual Funds are not insured by the Canada Deposit Insurance Corporation, nor guaranteed by ATBIM, ATB Securities Inc., ATB Financial, the province of Alberta, any other government or any government agency. Commissions, trailing commissions, management fees, and expenses may all be associated with mutual fund investments. Read the fund offering documents provided before investing. The ATB Funds include investments in other mutual funds. Information on these mutual funds, including the prospectus, is available on the internet at www.sedarplus.ca.
The information contained herein has been compiled or arrived at from sources believed to be reliable, but no representation or warranty, expressed or implied, is made as to their accuracy or completeness, and ATB Wealth (this includes all the above legal entities) does not accept any liability or responsibility whatsoever for any loss arising from any use of this document or its contents. ATB Wealth does not undertake to provide updated information should a change occur. This document may not be reproduced in whole or in part, or referred to in any manner whatsoever, nor may the information, opinions and conclusions contained in it be referred to without the prior consent of the appropriate legal entity using ATB Wealth. This document is being provided for information purposes only and is not intended to replace or serve as a substitute for professional advice, nor as an offer to sell or a solicitation of an offer to buy any investment.