
Q3 2026 IPM Economic & Market Summary
Discover key insights on global market resilience, divergent Canadian and U.S. growth, rising bond yields, and strategic portfolio positioning in the third quarter.

During the third quarter of 2026, global markets continued to demonstrate remarkable resilience in the face of significant macroeconomic and geopolitical developments. Renewed geopolitical conflict in the Middle East introduced renewed upward pressure on crude oil prices, adding to cost considerations across energy–importing regions.
At the consumer level, economic performance remained divergent and uneven. The Conference Board’s September US Consumer Sentiment survey highlighted growing sensitivity to elevated prices, particularly across fuel, services, and core goods.
Despite these headwinds, global equities pushed forward, powered by sustained corporate capital expenditure toward artificial intelligence infrastructure and positive earnings results. Conversely, fixed income markets drew headline attention as long-term sovereign bond yields remained elevated globally.
Total returns in Canadian dollar terms:
|
Major Market Indices* |
Quarterly return |
YTD return |
|
S&P/TSX Composite Index |
1.62% |
12.96% |
|
S&P 500 Index |
2.66% |
16.90% |
|
MSCI EAFE Index |
1.16% |
14.40% |
|
FTSE Canada Universe Bond Index |
-2.96% |
-0.78% |
Source: Bloomberg, data as of September 30, 2026
Here is how we are viewing the current economic and market landscape and the impacts on your capital.
Macroeconomic and regional outlook
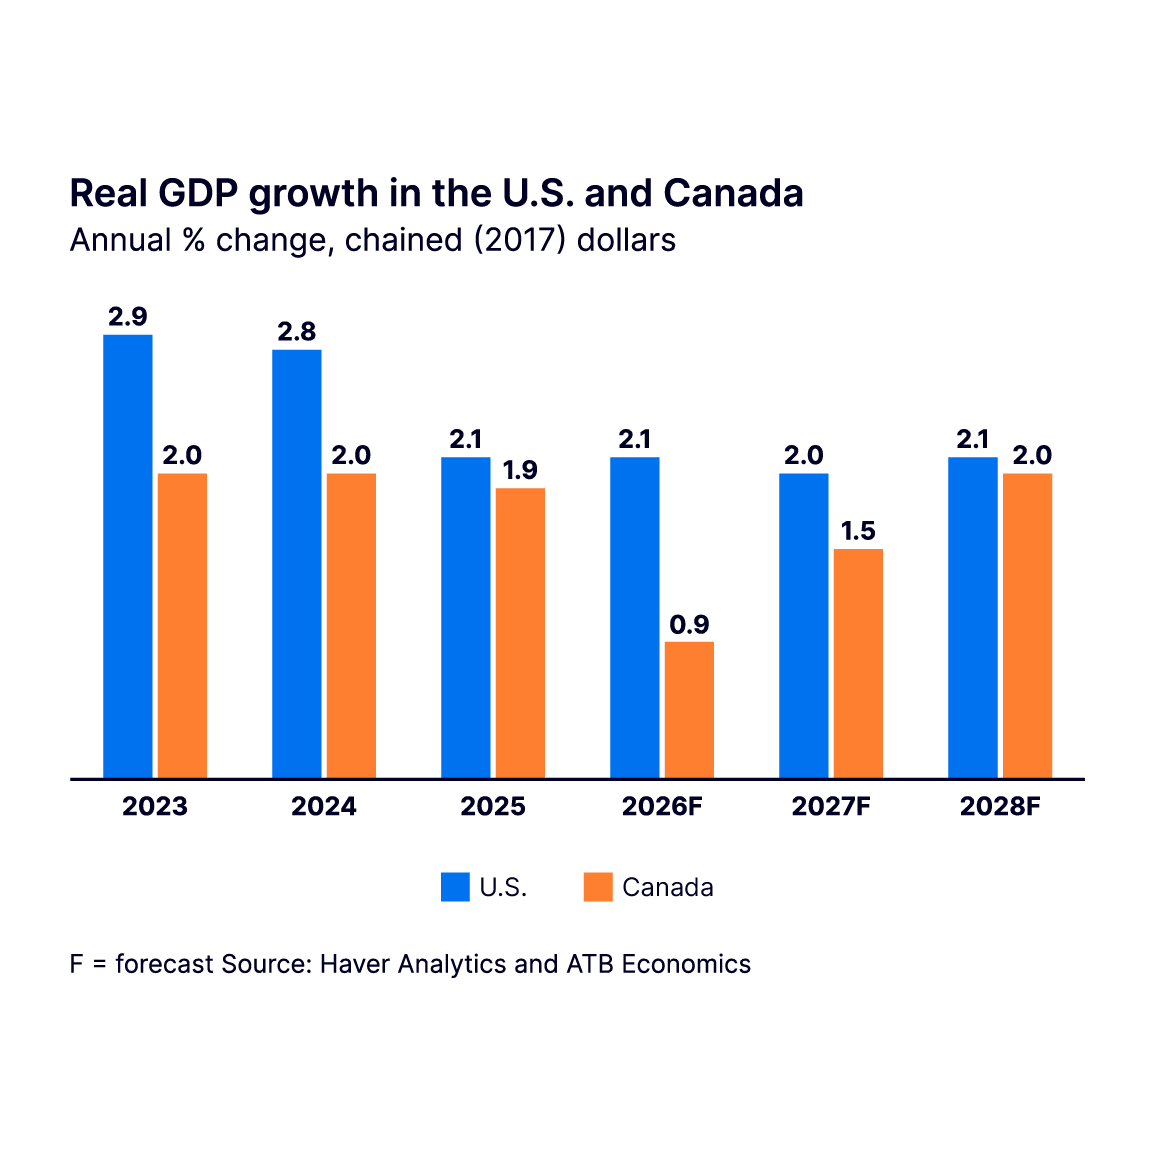
Projections from ATB economics’ most recent quarterly outlook highlights the varying growth between Canada and the US.
Canada
Canada’s broader economic outlook remains restrained, with persistent cross-border trade friction and trade policy volatility presenting sustained headwinds to growth.
Alberta stands out as a key economic driver, with ATB Economics projecting 2.6% GDP growth for the year—far exceeding the national average of 0.9%. This outperformance is driven by large-scale capital deployment in data centres, carbon capture facilities, petrochemicals, and natural gas infrastructure, alongside strong demographic growth and relatively affordable housing.
Federal policy support: To bolster competitiveness and business investment nationwide, Canada introduced several major policy incentives:
- Productivity mega deduction: Offers a permanent 100% immediate capital write-off for nearly two-thirds of business capital expenditures.
- Clean Economy Investment tax credits: Delivers over $90 billion in fully enacted tax credits across clean technology, electricity, CCUS, and hydrogen.
- Regulatory fast-tracking: Provides expedited CRA tax rulings for major infrastructure and energy projects exceeding $1 billion.
While these policy measures provide a strong structural foundation for major project buildouts, unlocking their full impact will require a resolution to cross-border tariff uncertainties and meaningful productivity improvements.
United States
The US economy expanded at a 1.5% annualized rate in the second quarter. Monetary policy came into sharp focus following initial Federal Open Market Committee (FOMC) meetings under Chair Kevin Warsh. The Federal Reserve adopted a more hawkish tone over the summer; after holding rates steady at its July meeting amidst three dissenting votes in favour of a rate hike, subsequent persistent inflation readings and strong employment prints reinforced market expectations for a 25-basis-point policy rate increase in September.
The Atlanta Fed’s GDPNow model continues to track accelerating economic output, driven by resilient private domestic investment and the global AI deployment cycle.
International & Emerging Markets
Global growth continues to bifurcate across regions:
- China: Reduced energy import volumes helped cushion global markets from more severe price spikes during recent supply disruptions. While Chinese domestic consumption remains soft, China is actively diversifying its trade relationships beyond the US while expanding its footprint in critical AI development.
- Europe: European economies face ongoing headwinds as net importers of energy and commodities routed through key maritime chokepoints like the Strait of Hormuz. Unfavourable agricultural conditions further constrained traditional export sectors. The ECB hiked rates 0.25% in September as inflation rose across the EU. The UK operates in a low-growth environment, a challenge that new Prime Minister Andy Burnham is tasked with fixing. France faces fiscal pressures and elevated sovereign borrowing costs.
- Asia-Pacific & India: India and neighbouring Asian economies continue to benefit from hardware and manufacturing demand tied to the global AI buildout. In Japan, structural shifts—including sustained wage growth, tight labour conditions, and domestically generated inflation—continue to support economic normalization.
Fixed income
Fixed income markets were defined by persistent yield pressures across long-dated sovereign debt. A notable market signal occurred when the yield on 30-year US Treasury Inflation-Protected Securities (TIPS) reached 3.28%, its highest reading since continuous issuance began in 2004.
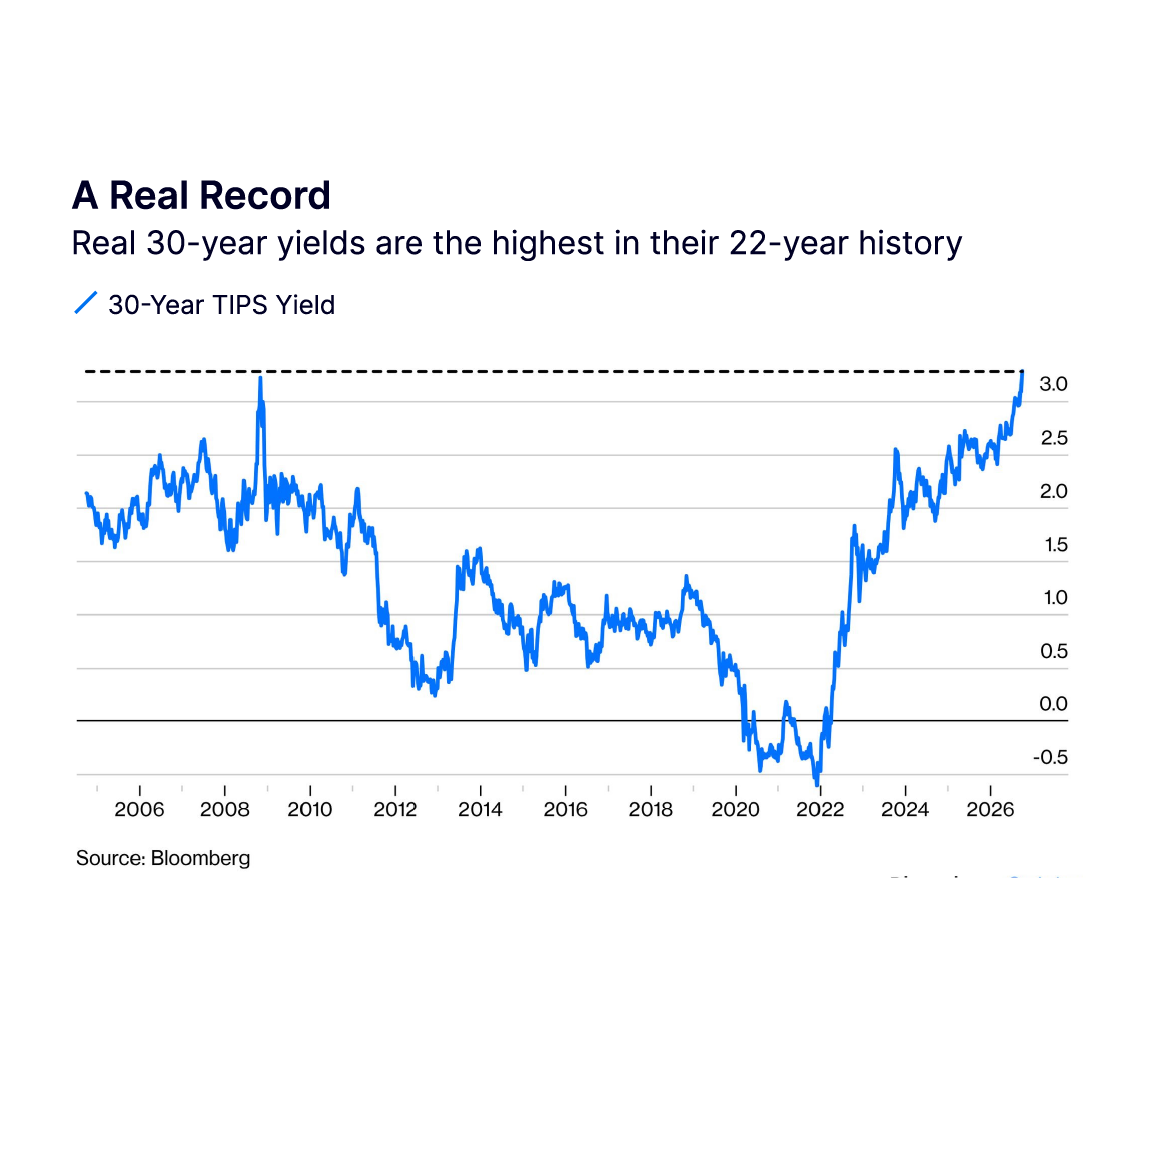
Yields on 5-, 10-, and 30-year US Treasuries all closed the quarter above 5.00%. These yield levels reflect market digestion of US national debt surpassing $40 trillion, energy price volatility, and heavy corporate bond issuance from technology hyperscalers financing capital buildouts. While US Treasury Secretary Scott Bessent outlined potential supply adjustments on the long end of the curve to alleviate upward rate pressure, yields remained elevated as the market digested the intervention.
In Canada, sovereign yields remain lower relative to US benchmarks, reflecting cooler domestic growth and a lower overnight policy rate structure from the Bank of Canada.
Equities
United States
US corporate earnings grew by 28% year-over-year in Q1. Analysts raised forward earnings expectations heading into Q2—an unconventional trend for the period—and have continued to revise Q3 projections upward. According to FactSet data:
- 86% of S&P 500 companies reported Q2 actual earnings per share (EPS) above consensus expectations.
- Broad Q2 earnings growth reached 52% year-over-year (or ~33% when excluding outsized contributions from Alphabet and Amazon).
- All 11 market sectors generated year-over-year revenue expansion in Q2, led by Energy (+42.5%) due to elevated crude prices, followed closely by Information Technology (+35.9%).
Canada
Canadian equity stocks also had encouraging earnings growth in Q2. Over half the constituents on the TSX posted double digit EPS growth in the second quarter. Performance in the third quarter was led by positive performance in the IT sector, Energy and the Materials sector—where precious metals and mining firms benefited from historic rallies in gold and silver spot prices.
Europe
European corporations posted sound fundamentals despite macroeconomic headwinds, delivering over 16% year-over-year earnings growth in Q2—their fastest pace of expansion in three years as reported from FactSet data. Improved profit margins, higher Return on Invested Capital (ROIC), operational capital efficiency, and strengthened commercial bank balance sheets demonstrate underlying corporate resilience across the region.
Positioning your capital
Investing in an equity bull market during an uneven economic backdrop requires a sharp focus on risk mitigation. We continue to prioritize active managers with a proven track record of generating strong risk-adjusted returns. Leveraging our open-architecture platform, we maintain the flexibility to exit strategies that no longer meet our investment objectives. Following thorough review and rigorous analysis by our dedicated research team, we exited our position in the Mawer US strategy during the second quarter.
Our equity allocation remains anchored in geographic, manager, and factor diversification, ensuring we are positioned to capture unique growth opportunities. Within fixed income, we have shifted toward higher credit quality, securing a robust AA average rating. Our current strategy prioritizes high-quality credit where we see compelling value in the 5- to 10-year segment of the yield curve, while deliberately limiting duration given persistent inflation uncertainty and volatility at the long end.
We remain committed to delivering tailored portfolio solutions aligned with your unique needs—pursuing growth in a risk-aware manner while keeping capital preservation at the forefront of our disciplined process.
ATB Investment Management Inc. (ATBIM) is registered as a Portfolio Manager across various Canadian securities commissions with the Alberta Securities Commission (ASC) being its principal regulator. ATBIM is also registered as an Investment Fund Manager who manages the ATB Funds. ATBIM is a wholly owned subsidiary of ATB Financial and is a licensed user of the registered trademark ATB Wealth.
Past performance is not indicative of future results. The mutual fund performance data provided assumes reinvestment of distributions only and does not take into account sales, redemption, distribution or optional charges or income taxes payable by any security holder that may reduce returns. Unit values of mutual funds will fluctuate and past performance may not be repeated. Mutual Funds are not insured by the Canada Deposit Insurance Corporation, nor guaranteed by ATBIM, ATB Securities Inc., ATB Financial, the province of Alberta, any other government or any government agency. Commissions, trailing commissions, management fees, and expenses may all be associated with mutual fund investments. Read the fund offering documents provided before investing. The ATB Funds include investments in other mutual funds. Information on these mutual funds, including the prospectus, is available on the internet at www.sedarplus.ca.
The information contained herein has been compiled or arrived at from sources believed to be reliable, but no representation or warranty, expressed or implied, is made as to their accuracy or completeness, and ATB Wealth (this includes all the above legal entities) does not accept any liability or responsibility whatsoever for any loss arising from any use of this document or its contents. ATB Wealth does not undertake to provide updated information should a change occur. This document may not be reproduced in whole or in part, or referred to in any manner whatsoever, nor may the information, opinions and conclusions contained in it be referred to without the prior consent of the appropriate legal entity using ATB Wealth. This document is being provided for information purposes only and is not intended to replace or serve as a substitute for professional advice, nor as an offer to sell or a solicitation of an offer to buy any investment.