
Putting the odds on your side
Investing isn’t gambling, because the odds are well in our favour when done properly.

Investing success is most reliably achieved through a suitable asset mix, proper diversification, and, above all else, disciplined management. However, following these principles consistently is easier said than done and doesn’t necessarily ensure a perfect ride.
Roger Federer is considered the greatest male tennis player in history (cue the debate), but even his track record is far from flawless. In a recent commencement speech at Dartmouth University, Federer laid out some surprising statistics about his experience as a player:
In tennis, perfection is impossible… In the 1,526 singles matches I played in my career, I won almost 80% of those matches… Now, I have a question for all of you… what percentage of the POINTS do you think I won in those matches? Only 54%.
His edge on points won was surprisingly slim, just above 50%. There is a nice parallel in investing, when comparing the win rates over various time periods.
| All matches | |
| % points won | 54% |
| % games won | 58% |
| % sets won | 76% |
| % matches won | 82% |
Source: UltimateTennis Statistics.com
The S&P 500 is a stock market index which tracks the performance of the largest publicly traded companies in the United States. It's regarded as one of the best gauges of stock market performance because of its long history and breadth of industries and sectors. From 1970 to 2023, the S&P 500 generated a positive return in 59% of months and 80% of calendar years.
% of time stocks are up: 1970-2023
| Time frame | World ex-US | S&P 500 |
|---|---|---|
| Monthly | 59.4% | 63.4% |
| One year | 70.4% | 80.0% |
| 5 years | 91.9% | 90.5% |
| 10 years | 99.6% | 95.4% |
| 15 years | 100.0% | 100.0% |
| 20 years | 100.0% | 100.0% |
Data: Returns 2.0
Source: A Wealth of Common Sense
These attractive odds work wonders for a financial plan and illustrate the importance of discipline and time. The probability of a positive return in the market significantly improves as the holding period lengthens, despite a relatively modest winning percentage on any given day.
The Agony & The Ecstasy
One hard truth about investing is that most investors struggle to make money by dabbling in the stock market. Sure, we’ve all heard the cocktail party stories—whether truth or fiction—about “ten-bagger” success stories, yet the reality is that cherry-picking stocks is hard. Really hard. An under-appreciated reason for this is the shocking number of stocks that don’t perform well over time.
JP Morgan Asset Management recently updated their study “The Agony & The Ecstasy,” which takes a deep dive into the performance of the US stock market over the past 40 years, from 1980 to 2020. The study found that nearly half the stocks suffered a “catastrophic loss,” defined as a decline of 70% or more and never recovered. Furthermore, another 26% of stocks generated below-market returns. So roughly eight in ten stocks resulted in sub-par results for investors—a humbling reality. Despite this, the US stock market generated significant wealth overall during this period.
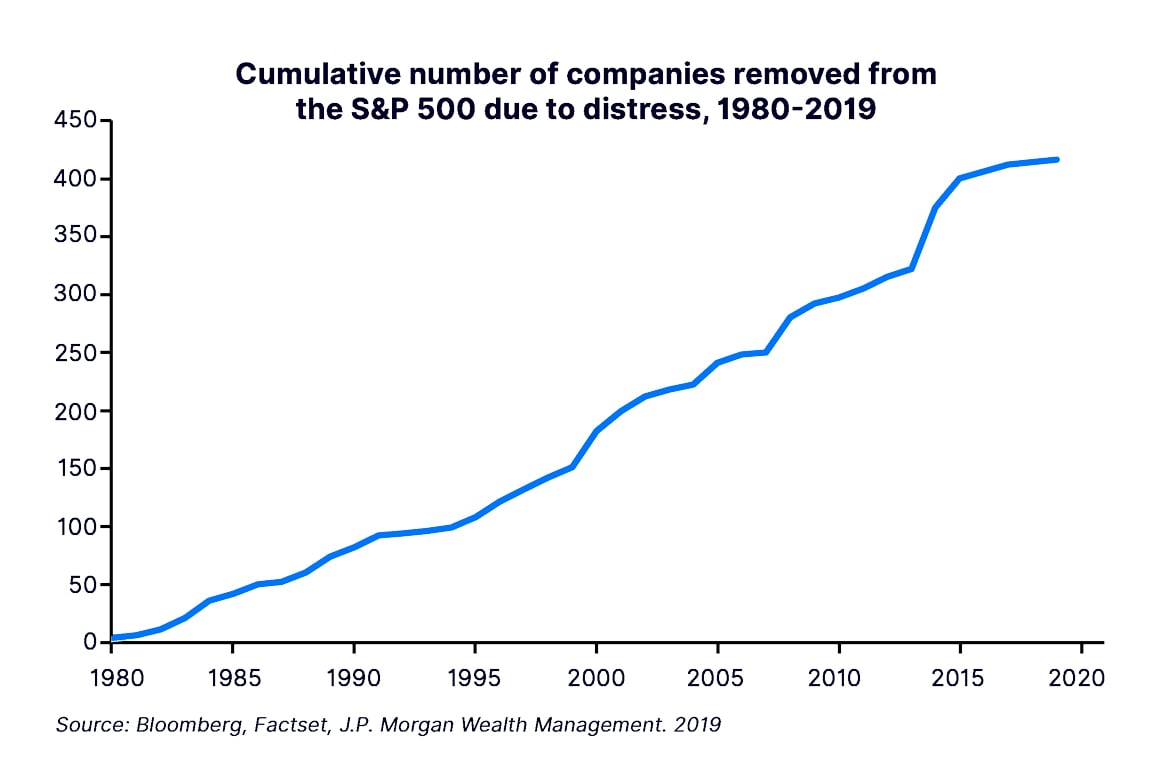
Recap & update of Agony & Ecstasy findings
| Sector | Total % of companies experiencing "catastrophic loss" 1980-2020 |
|---|---|
| All sectors | 44% |
| Communication Services | 49% |
| Consumer Discretionary | 48% |
| Consumer Staples | 32% |
| Energy | 65% |
| Financials | 29% |
| Health Care | 48% |
| Industrials | 39% |
| Information Technology | 59% |
| Materials | 38% |
| Utilities | 14% |
Source: Factset, Bloomberg, J.P. Morgan Wealth Management. September 2020
How? A small segment of stocks (10%) did all the heavy-lifting for the market, a segment of stocks which JPMorgan coined the “mega winners.”
Speaking to the benefits of a systematically managed and diversified portfolio will never be exciting. Investors are often far more interested in speculating on the next great “mega winner,” and in the process, succumb to the allure of "hot" investment themes, driven by the possibility of fast-tracked gains. This behaviour leads to chasing trends without proper consideration, often resulting in buying high and selling low: a capital destructive cycle. A prime example is the dot-com bubble of the late 1990s, where investors poured money into internet-related companies, driving valuations to unsustainable levels. The subsequent crash wiped out billions in wealth.
Any shortcuts in investing are riddled with landmines. But the temptations are endless: The Dot Com bubble of the 1990s, the recent frenzy surrounding meme stocks and cryptocurrencies, or the allure of the latest star fund manager like Cathy Wood’s ARKK Innovation Fund1. All hardy reminders of the dangers of too-readily following the hype and over-concentrating your wealth.
While you can make a huge profit if you pick the right stock, history shows it’s a poorly placed bet where the odds are significantly stacked against you. It’s been said that diversification is the one free lunch in investing. It’s also the most reliable way to establish your edge when achieving your financial goals.
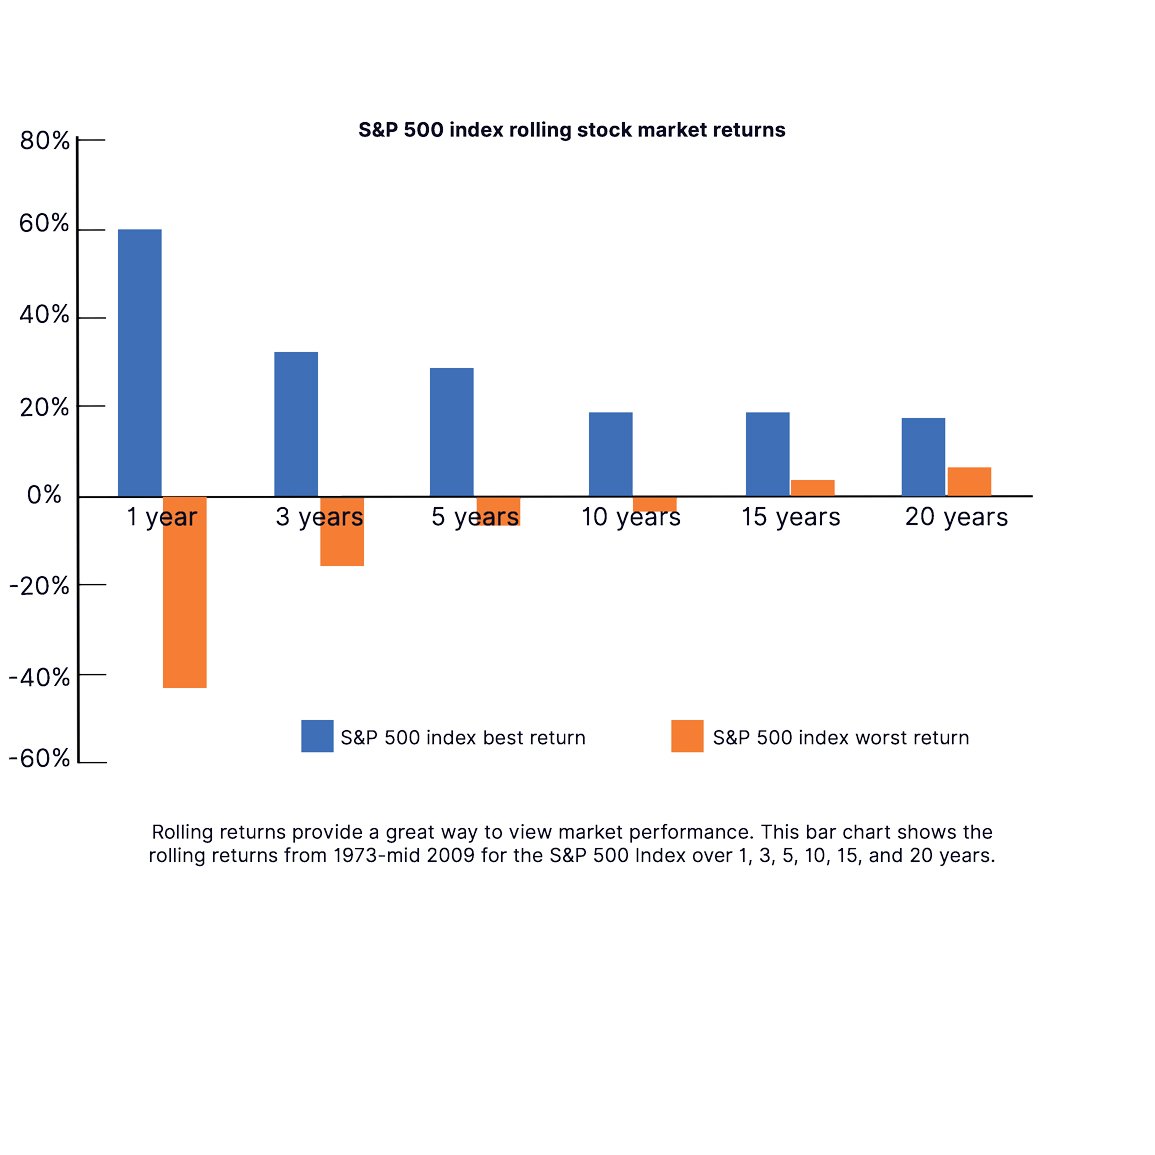
"Rolling returns do not go by the calendar year; instead, they look at every time period beginning anew each month over the historical time frame selected (e.g., one-year, three-years, five-years). Rolling returns give you a great picture of how the stock market performs over both good and bad times.2" This chart tracks the S&P 500 index giving a look at how long term investments would perform within the American stock market.
This report has been prepared by ATB Investment Management Inc. (ATBIM). ATBIM is registered as a Portfolio Manager across various Canadian securities commissions with the Alberta Securities Commission (ASC) being its principal regulator. ATBIM is also registered as an Investment Fund Manager who manages the ATB Funds, Compass Portfolios and the ATBIS Pools. ATBIM is a wholly owned subsidiary of ATB Financial and is a licensed user of the registered trademark ATB Wealth.
Past performance is not indicative of future results. Opinions, estimates, and projections contained herein are subject to change without notice, and ATBIM does not undertake to provide updated information should a change occur. The information in this document has been compiled or arrived at from sources believed reliable but no representation or warranty, expressed or implied, is made as to their accuracy or completeness. ATB Financial, ATBIM and ATB Securities Inc. do not accept any liability whatsoever for any losses arising from the use of this report or its contents.
The material in this document is not, and should not be construed as, an offer to sell or a solicitation of an offer to buy any investment. This document may not be reproduced in whole or in part; referred to in any manner whatsoever; nor may the information, opinions, and conclusions contained herein be referred to without the prior written consent of ATBIM.