
Markets, investing and what matters most: Quarter in review Q4, 2022
The Private Investment Counsel team recaps market performance in 2022, and offers insights on what might lie ahead for 2023.

There is no denying that investor concerns about rising interest rates, slowing economic growth and persistently high inflation triggered sustained bouts of selling throughout 2022. Tech stocks, growth names and cryptocurrencies were hit particularly hard. The TSX ended the year down despite the strong returns in early 2022 due to energy. S&P 500 Index and long-term treasury bonds experienced double-digit declines for the first time since 1969. Diversifying globally didn't provide much relief either, as the MSCI EAFE index and emerging market indices also experienced losses.
While the stock market and bond market both had a tough year in 2022, there are some indications that things may start to improve. Some experts are suggesting that the Federal Reserve may be able to achieve a "soft landing," which would help to stabilize the economy.
One positive sign is that inflation appears to have peaked and is falling faster than many had expected. Additionally, the economy has shown some signs of recovery, with GDP growing in the third quarter and the labour market remaining strong. Moreover, many of the supply chain linked shortages are working themselves out.
It is due in part to these things that global markets rallied in the fourth quarter–stock and bond markets are forward looking and pessimism presents opportunities. As long-term investors, we can find opportunities in this environment. To quote Warren Buffet in his 1990 Chairman’s Letter to Shareholders:
The most common cause of low prices is pessimism – sometimes pervasive, sometimes specific to a company or industry. We want to do business in such an environment, not because we like pessimism but because we like the prices it produces.
Key highlights from the last quarter
Economics
- The Canadian unemployment rate decreased 0.1% to 5.0% in December, just above the record low of 4.9% reached in June and July. Average hourly wages were up 5.1% over the year but failed to keep pace with inflation.1
- The unemployment rate in the US edged down to 3.5% in December. Average hourly wages increased 4.6% over the year, the least since August 2021 and below market estimates of 5%.2
- Annualized Q3 GDP for the US was confirmed at 3.8% in December and 2.9% in Canada with both experiencing positive growth over the past few quarters.
- Surging inflation, a hawkish Federal Reserve and slower economic growth have contributed to a strong US dollar in 2022, closing out the year at 1.3569 CAD
Markets
- The last quarter in 2022 saw positive returns from all major asset classes such as fixed income and equity indices.
- The S&P 500 finished the quarter up 5.4%, the S&P/TSX up 6.0%, and developed international markets (measured by the MSCI EAFE) up 15%, all in Canadian dollar terms (Bloomberg).
- The yields on 10-year Canada Government and US Treasuries were 3.3% and 3.9% respectively at the end of 2022. Although the increase in yields means higher costs for borrows, the flipside is savers have more options to earn a return without taking on a lot of risk.
Chart of the quarter
The market is cheaper than it appears
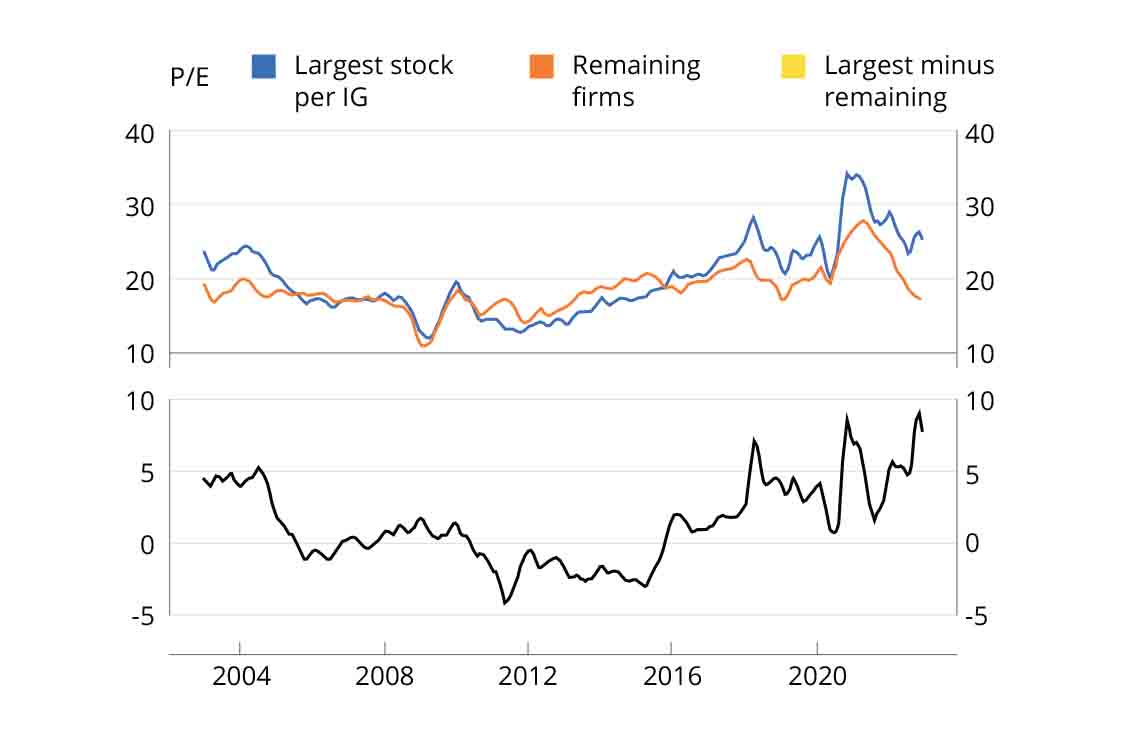
Based on a universe of the top 500 US domiciled stocks trading on US exchanges by market cap. Market weighted. Source: S&P Capital IQ.
On a broad-based basis, the market is cheaper than it optically appears, as the elevated valuations of the largest stocks in the index lift the overall index price to earnings ratio. This also suggests that the bottom 476 stocks are more representative of what the stock market is pricing than the top 24 stocks. Excluding the largest companies that are likely to fare relatively well even in a recession, the market is pricing in quite a bit of bad news.
An update on our funds
During the quarter, all the funds, which include the Compass O Series portfolios and ATBIS Pools O Series, had positive returns.
For fixed income, the last quarter saw positive relative returns gaining roughly 1% compared to the 0.6% for the FTSE Canada Universe Index. Holding bonds that were shorter in term, and therefore less price sensitive to interest rate movements, was the primary difference.
We continue to focus on building quality, including increasing the percentage of holdings in high-quality AA and AAA ratings. These changes position the funds to capitalize on potential opportunities in the credit market, should a recession occur. In the meantime, the overall bond portfolio including mortgages as of the end of the quarter was priced to yield 6.29%
Equities saw moderate movement over the quarter. The majority of the holdings remained the same and the sub-advisors focused on finding well-managed resilient businesses. The funds ended close to overall benchmarks with Canada and US ahead but lagging international. In early December, Picton Mahoney Asset Management was added as a new Canadian equity small cap sub-advisor for the funds, and is known for its attractive risk adjusted performance and consistent downside protection.
Compass Portfolios and ATBIS Pools Returns Series O, Q4, 2022
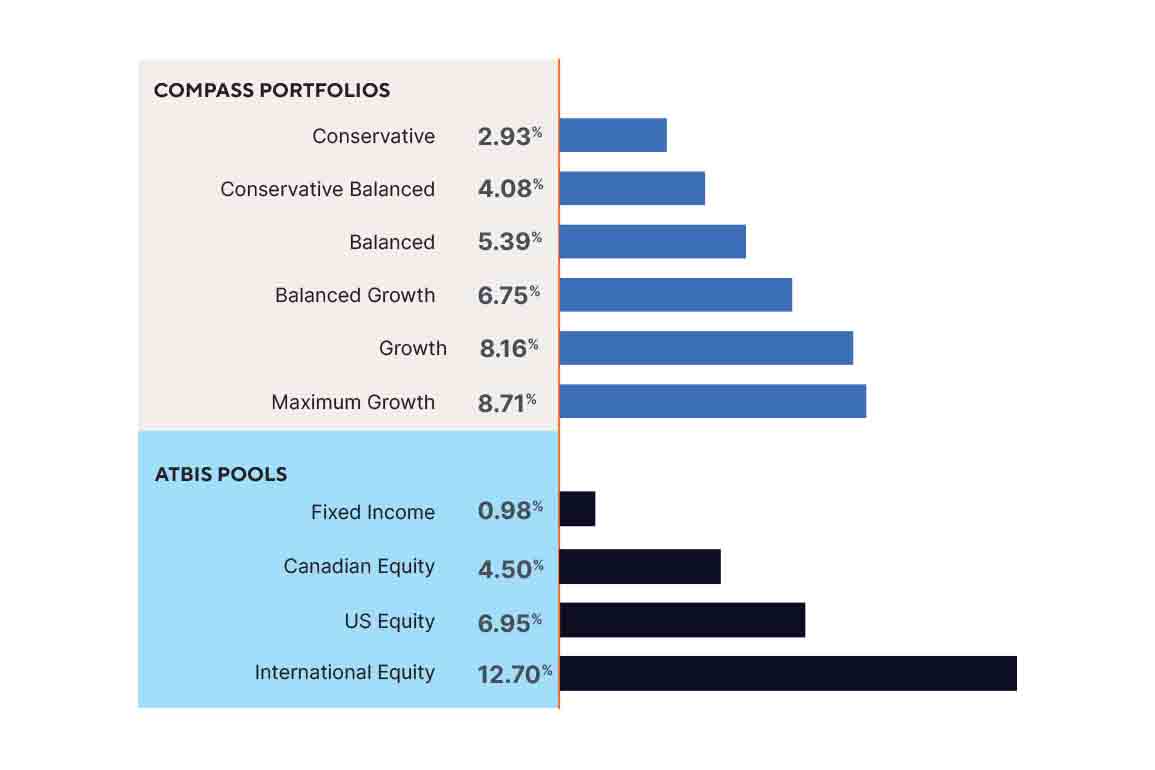
Source: ATB Investment Management Inc.
Conclusion
2022 has been more challenging than usual for investors as both bonds and equities were down at the same time for the year. Despite the last quarter being positive, volatility will likely continue into 2023 but as inflation moderates we believe that it’s important to stay invested. Whether it's a bear market or an upcoming recession, it’s important to remember that these periods do not last forever and to remain focused on your long-term strategy. Company balance sheets remain strong and valuations today in both stock and bonds are attractive for the long term, which can create opportunities for future growth. We remain confident that the strength of our portfolios will help mitigate the impact of volatility and achieve our portfolio investment objectives over the long run.
What we’re reading, watching and listening to
Podcast
S-curves and the adoption
Mawer’s Grayson Witcher talks about S-curves and describes the rate of adoption and penetration of a given technology or product over time.
Articles
How do stocks and bonds perform following big down years - By Ben Carlson
A look at how stocks and bonds perform following big down years.
This report has been prepared by ATB Investment Management Inc. (ATBIM). ATBIM is registered as a portfolio manager across various Canadian securities commissions, with the Alberta Securities Commission (ASC) being its principal regulator. ATBIM is also registered as an investment fund manager and manages the Compass Portfolios and the ATBIS Pools. ATBIM is a wholly owned subsidiary of ATB Financial and is a licensed user of the registered trademark ATB Wealth.
The performance data provided assumes reinvestment of distributions only and does not take into account sales, redemption, distribution or optional charges or income taxes payable by any security holder that may reduce returns. Unit values of mutual funds will fluctuate and past performance may not be repeated. Mutual Funds are not insured by the Canada Deposit Insurance Corporation, nor guaranteed by ATBIM, ATB Securities Inc. (ATBSI), ATB Financial, the province of Alberta, any other government or any government agency. Commissions, trailing commissions, management fees, and expenses may all be associated with mutual fund investments. Read the fund offering documents provided before investing. The Compass Portfolios and ATBIS Pools include investments in other mutual funds. Information on these mutual funds, including the prospectus, is available on the internet at www.sedar.com.
Opinions, estimates, and projections contained herein are subject to change without notice and ATBIM does not undertake to provide updated information should a change occur. This information has been compiled or arrived at from sources believed reliable but no representation or warranty, expressed or implied, is made as to their accuracy or completeness. ATB Financial, ATBIM and ATBSI do not accept any liability whatsoever for any losses arising from the use of this report or its contents.
This report is not, and should not be construed as an offer to sell or a solicitation of an offer to buy any investment. This report may not be reproduced in whole or in part; referred to in any manner whatsoever; nor may the information, opinions, and conclusions contained herein be referred to without the prior written consent of ATBIM.