
Are GICs a good short-term solution for long-term investing?
With the Bank of Canada raising interest rates since the end of 2021, GIC rates have hit over the 4% mark. So, should long-term investors be considering them?

With the Bank of Canada raising rates significantly since the end of 2021, guaranteed investment certificate (GIC) rates have hit over 4% and, in some cases, even well over 5% depending on the lender and term. For those with short-term goals such as saving for a car or property, investing with no risk to principal at these rates is a boon compared to much lower rates often seen over the past decade. Those with longer time horizons may also consider locking into these rates.
This article focuses on whether longer-term investors should also be considering GICs today. We compare how GICs in Canada have historically fared against a few different conservative investment options.
Based on historical data, our conclusions point to the long-term investor staying invested rather than switching to GICs. It is especially true when stock and bond prices have already declined, and time horizons are longer.
A historical look at GIC rates in Canada
Historical GIC rates can be hard to come by from any individual bank. Luckily, the Bank of Canada (BoC) has been collecting this information since March 31, 1982 and this data can be used to run comparison scenarios. The BoC’s methodology to gather these rates involves sampling the 1-, 3-, and 5-year non-redeemable posted rates from the six largest banks in Canada1. They take the rate that occurs most often across the six (the mode), or if no mode exists, then the rate closest to the simple six-bank average. We calculate a 2- and 4-year rate as the simple average of the 1- and 3-year rates and the 3- and 5-year rates respectively, to give us our 1-5-year historical GIC rate data set2.
How GICs have done historically compared to various portfolios
We can see how an investment strategy utilizing only GICs would have fared using the historical GIC data since 1982. For comparison, we have also plotted Canadian inflation, an index of short-term (1-5 year) bonds3, the overall Canadian bond index4 (which includes the vast majority of investment grade bonds in Canada), and a typical conservative balanced portfolio containing a 60% weighting in bonds and 40% weighting in global stocks5.
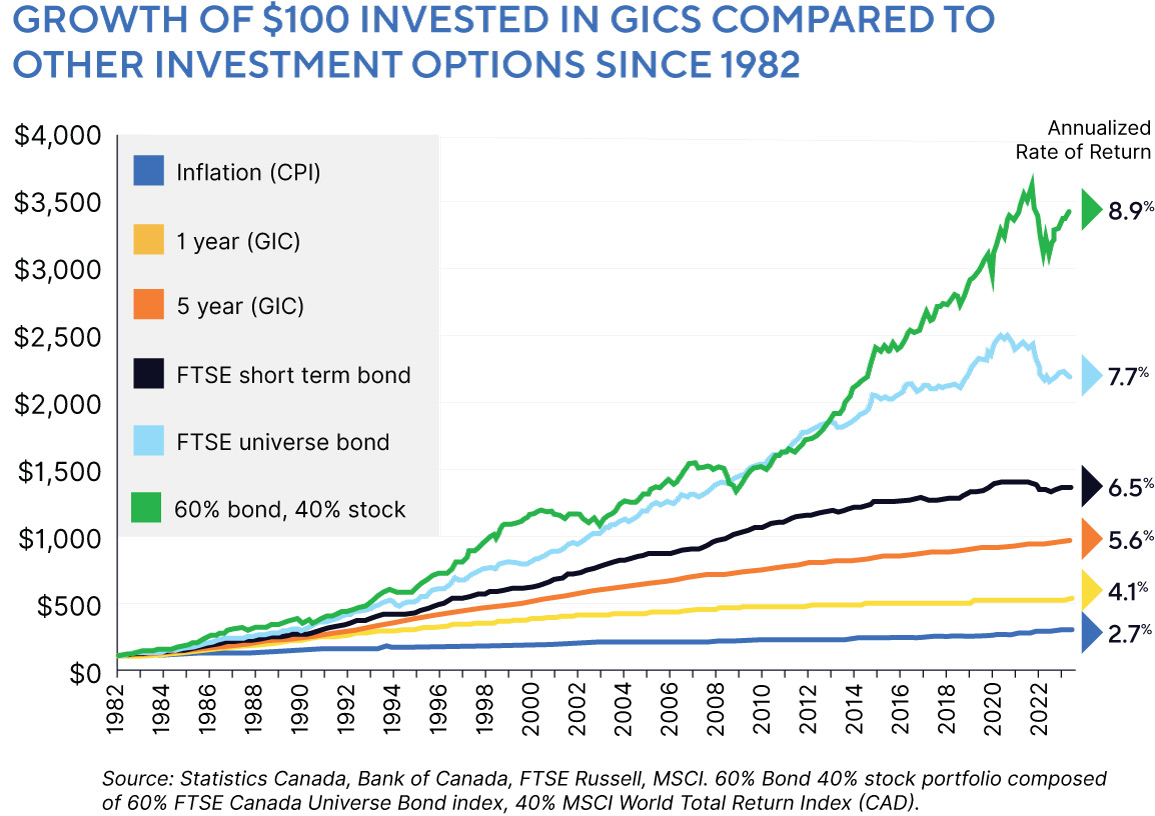
Riskier options that include stocks and bonds over the long term could reward an investor with better returns, and they have over the past 40 years or so. As we can see from the chart, GICs offer a steady return with no deviations. Given the volatility that affects markets from time to time—including 2022, which impacted both stock and bond markets negatively—are there still times when it pays to sit out of the market for a while and take advantage of higher-than-normal rates, such as today?
When have GICs performed better than bonds or balanced portfolios?
To determine when GICs have outperformed, we compare their performance to the FTSE Universe Bond Index (the bond portfolio). GICs and bonds have similar characteristics in that interest rates explain much of their return over time. The primary difference is that bonds can be bought and sold anytime, whereas GICs—or at least the non-redeemable ones in this example—are held to maturity. This should provide a clearer picture on whether buying GICs at high rates historically has been favourable.
The chart below compares investing in a one-year non-redeemable GIC to the bond portfolio. The gray bars show the prevailing one-year GIC rate at that time. The blue line shows the excess return generated by holding the bond portfolio instead of the GIC for a one-year period.
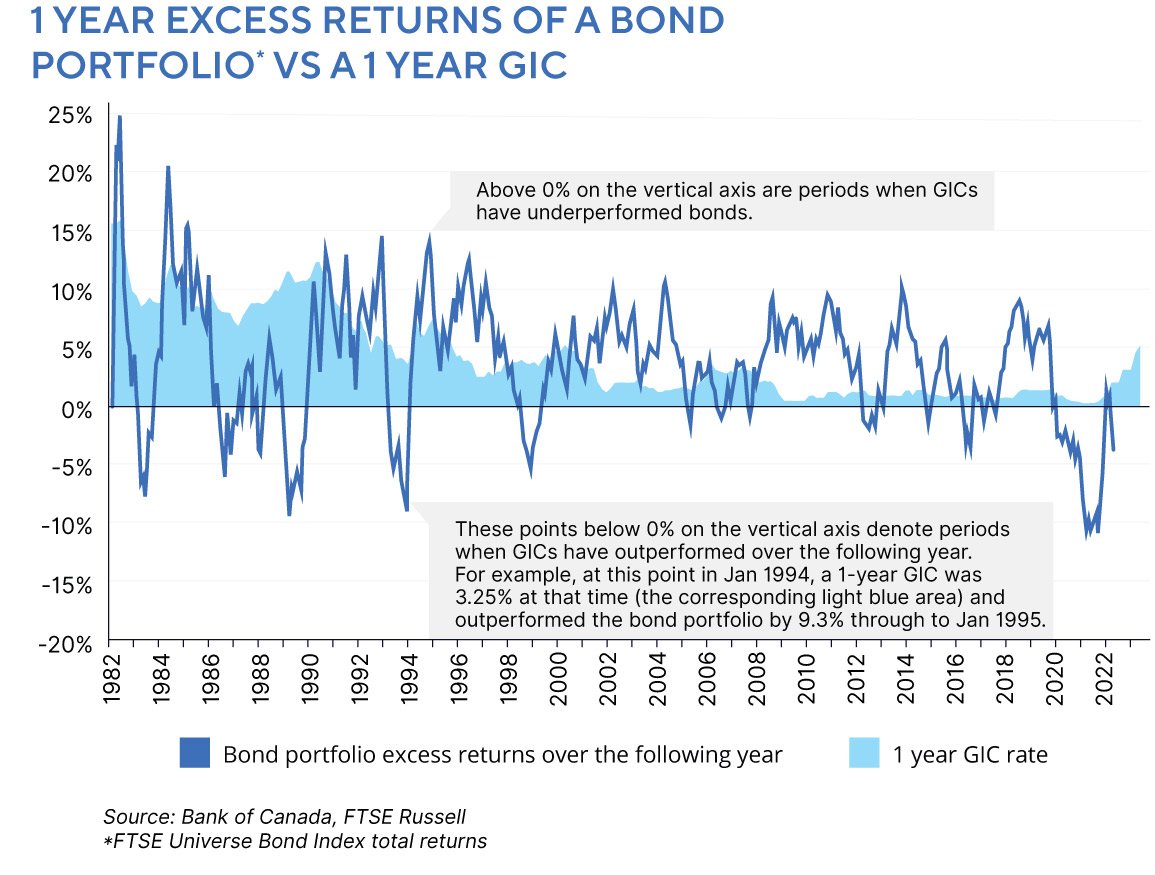
On average, the bond portfolio mostly provides excess returns where the blue line is above zero. This aligns with the first chart showing annualized performance, where the bond portfolio generated 7.7% over the period compared to 4.1% for the one-year GIC. There are periods when bonds underperform—2021-2022 being the most recent example—when bonds lost roughly 10% of their value.
In looking at the peaks and valleys of the one-year GIC rates depicted by the gray bars, often the best time to invest in a GIC—when the blue line is under 0% showing GIC outperformance—has been when rates tend to be lower in the cycle. The most notable were 1983, 1987, 1990, 1994, 1999, and 2021. In these periods, bonds underperformed the one-year GIC by 5% or more, yet all saw the GIC rates continuing to increase over the following year or two.
This performance makes sense because, as we know from last year, bonds lose value as interest rates increase. A bond’s price will decline as rates rise to make the bond more attractive (offer a higher yield). Therefore the bond becomes marketable and of equal attractiveness to investors who can compare it to other recently issued bonds offering more attractive yields. The older bonds priced lower give not only interest income but also capital appreciation to a new buyer. A GIC doesn’t fluctuate in price, so in these periods, bonds lose value, and GICs remain constant.
After interest rates have risen for a time, the economy typically begins to slow, prompting the central bank to start cutting rates to try and stimulate growth again. Historically, the result is a period where despite getting an attractive rate on GICs, they typically underperform bonds that pay interest and see their prices rise as rates decline.
While it’s counterintuitive, overall, the best time to invest in GICs tends to be when rates are lower and market values are high. In effect, buying a GIC before rates increase, such as at the end of 2021—even though GIC rates were very low at the time—allows an investor to avoid situations such as in 2022 when bond prices and even stocks declined as rates rose. Timing the market like that sounds simple enough in theory, but in practice, consistently guessing when a period of higher interest rates is imminent is almost impossible. Next, we look at how GICs tend to perform after rates have increased, when bond and stock markets are already in a decline to varying degrees.
For long-term investors, staying invested, especially in down markets, is optimal
The reason for making the choice to move to a cash option is often to step out of the market for a while and see how the current events impacting markets unfold. However, when markets feel uncomfortable, that’s usually the best time to stay invested.
To demonstrate and continue with the bond portfolio example, table A below shows how often bonds have outperformed a comparable GIC. The data is split into times when bonds have already been in a decline from the last time they hit a new high6, as well as the number of years invested. For a one-year period, the comparison is to a non-redeemable one-year GIC, two years for a two-year GIC and so on, up to locking in for a five-year GIC.
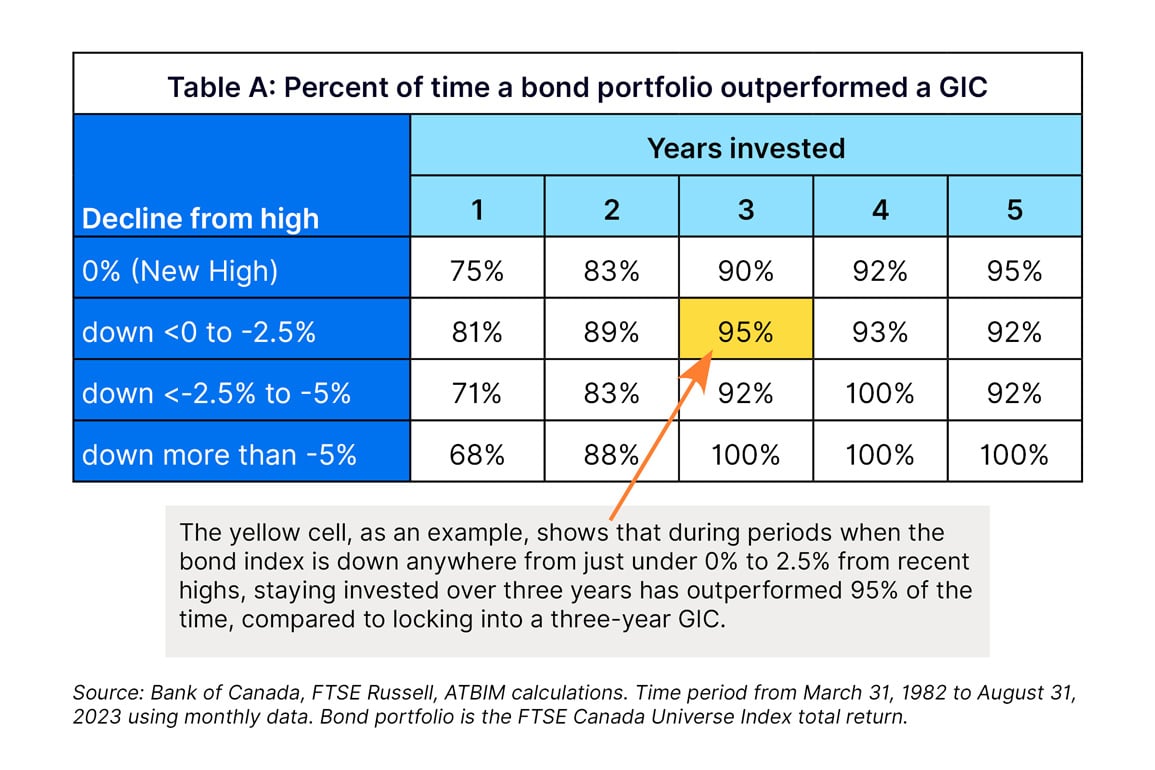
Overwhelmingly, the historical data points to the bond investor staying invested no matter the market circumstance. Notably, probabilities of bonds outperforming comparable term GICs rise in market declines and with longer time horizons (toward the bottom right of the table).
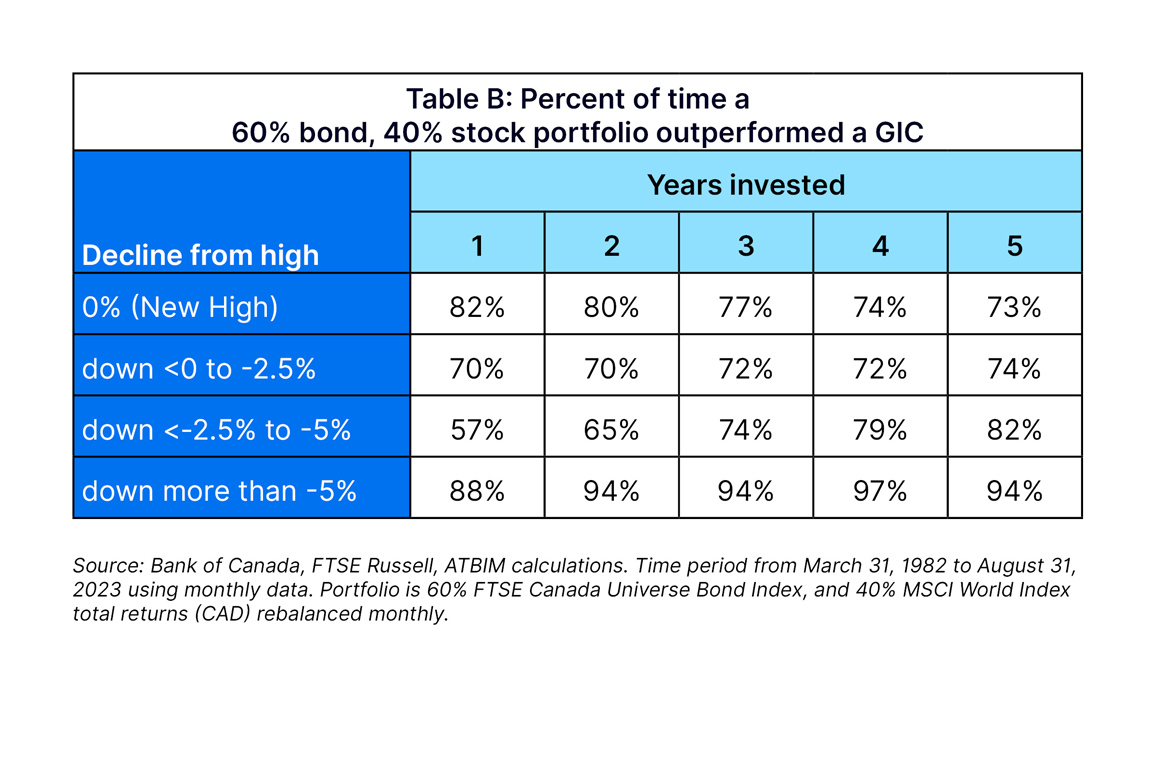
For investors with stocks, we find a similar trend in table B where all cases, on average, beat a GIC, but the best times to stay invested tend to be in down markets, especially for those with longer time frames.
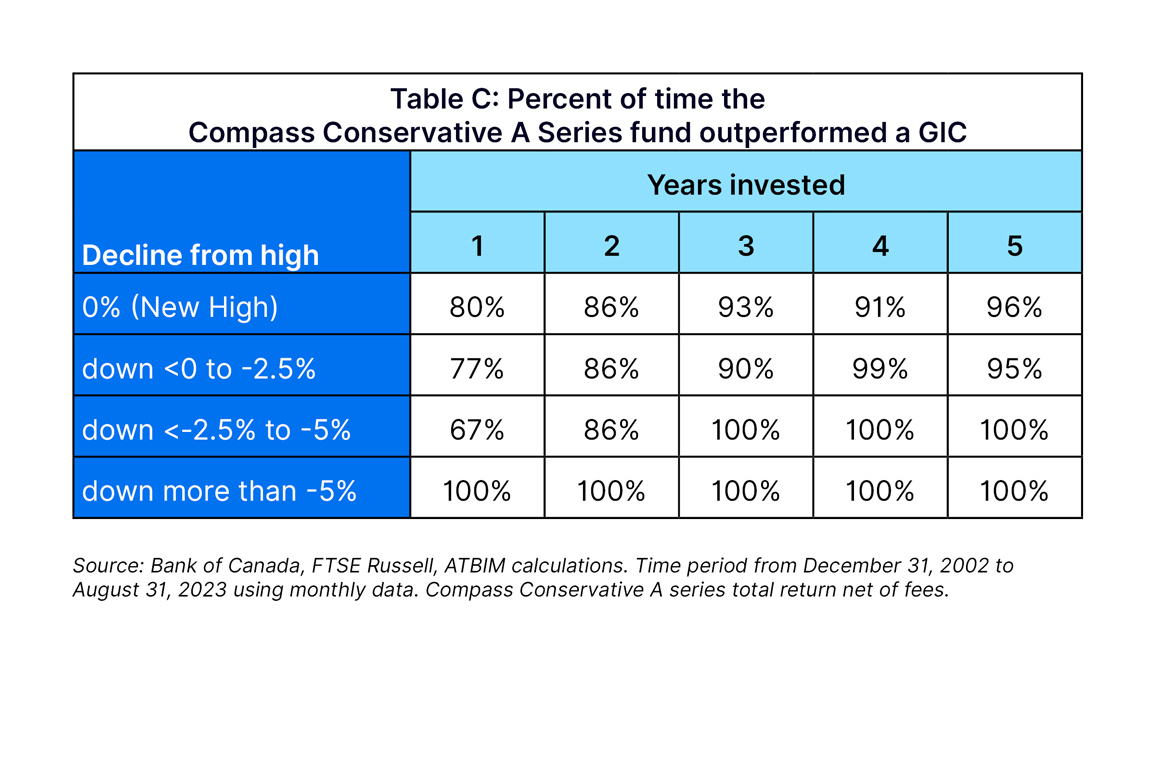
For the third example, we show Compass Conservative A series net of all fees compared to GICs as a real-life example for ATBIM clients. Compass Conservative has an inception date of 2002 and therefore does not have as long of a data set as the above two examples, but with over 20 years, it shows a very similar trend. Staying invested in any circumstance—especially a down market with longer time horizons—has a high probability of excess returns for the investor.
Lastly, we ran the same three scenarios assuming a 1% higher rate on all GICs. After all, the BoC doesn’t sample GIC rates from smaller institutions or rate specials that can offer higher rates. Adding the extra percent against the three market portfolios above resulted in a lesser chance of 4.8% to 5.3% of outperforming a GIC. The bond portfolio was the worst off, declining 5.3% on average across the range—see the updated results in table D.
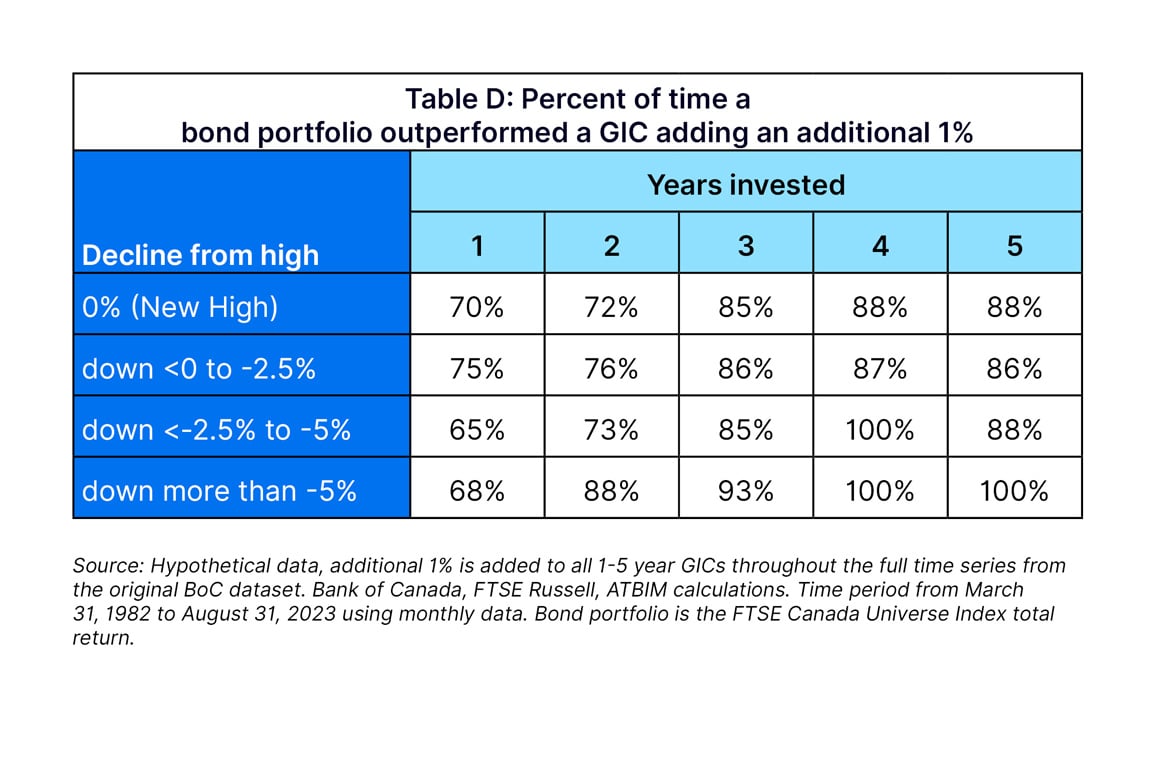
Compared to table A, table D shows the bond portfolio outperforming less when the market was at or near new highs compared to the higher rate GIC. The bond portfolio maintained a similar chance of outperforming when prices were already in decline. Rate increases causing declines tend to cycle with rate declines, giving additional capital gains to bonds. Despite the additional 1% on the GIC, the historical probabilities still favour the market solutions from a return perspective.
For these examples, it is important to note that just because something has worked over past periods—even 100% of the time in some of the cases shown—there is no guarantee that it will hold true for the future. Markets can always surprise, so it’s essential to consider all aspects beyond just return.
Liquidity, Volatility, and Risk
At face value, GICs have essentially zero volatility compared to bonds, providing a steady rate of return. However, price stability comes at the cost of liquidity. Bonds and stocks, on the other hand, offer liquidity but fluctuate in price. A bond dropping in price, and its perceived loss in value, may not necessarily be a permanent loss. Consider a bond purchased at par (or a price of $100) that is held to maturity. Since bonds mature to par, the bond purchaser will receive the amount invested into the bond upon maturity (barring any defaults), plus all of the interest payments made in the interim. Even if the bond price falls to $90 or rises to $110 as interest rates rise or fall, the bondholder will still receive the par value upon maturity. This is similar to a GIC, except for the price fluctuations. If GICs were marketable, a GIC holder would see similar price fluctuations throughout the holding period.
Holding any security other than cash comes with a certain amount of risk. In the case of GICs, this risk is minimized as it is a guaranteed instrument that stands at the top of the credit structure, equivalent to deposits in the case of a default. GICs from eligible institutions are also qualified for Canada Deposit Insurance Corporation (CDIC) coverage, meaning they have a government guarantee up to the eligible amount per client per institution should a default occur. Separately, the Alberta Government guarantees the total amount of ATB Financial GICs purchased by Alberta residents. Bondholders, on the other hand, do not have this guarantee. Bonds stand below deposits and GICs but stand above equity holders in the case of insolvency. The increased risk is compensated by a higher yield demanded by investors.
A note on taxes
The tax treatment is of no concern to those who hold GICs in their registered accounts, such as RRSPs or TFSAs. However, for those with GICs in a non-registered account, interest proceeds are taxed at your marginal tax rate, which can vary between 25% and 48% for Albertans in 2023, depending on your level of taxable income. The tax treatment of bonds is the same for interest payments but can differ depending on the price at which the bond was purchased. Any gain or loss on the sale of a bond is considered a capital gain or loss for tax purposes. As capital gains are taxed at half the individual's marginal income tax rate, a realized capital gain upon maturity or sale of the bond can result in preferential tax treatment of the proceeds, providing an advantage versus a purely income-based return such as that in a GIC.
To conclude
A 5% GIC rate can be enticing. An investor knows what to expect; the value will not fluctuate and, for the first time in a long time, the rate is likely to outpace inflation with a reasonable margin. Market options like stocks and bonds, by contrast, are more opaque. An investor only has reasonable estimations for returns over the period. Volatility often brings emotional stress to the point where the additional return likely isn’t worth the risk for some.
As attractive as that 5% rate is, investors today can pick up bonds and stocks at attractive valuations. If rates should decline, an investor has further upside with rising bond prices. For those balanced investors, stocks are still at lower prices than in 2021 and add diversification.
Unless personal objectives have changed, staying the course with a well-designed investment plan is key to meeting long-term goals.
1 Royal Bank, TD Bank, Bank of Nova Scotia, CIBC, Bank of Montreal, and National Bank.
2 Later referenced as ATBIM calculations in this article
3 FTSE Canada Short-Term Universe Index total return
4 FTSE Canada Universe Bond Index total return
5 60% FTSE Canada Universe Bond Index, 40% MSCI World Index total return (CAD)
6 The last time the FTSE Canada Universe Bond index hit a new high was August 3, 2021. From that high level, the index as of August 31, 2023 is in a decline still of 9.8%.
ATB Wealth® (a registered trade name) consists of a range of financial services provided by ATB Financial and certain of its subsidiaries. ATB Investment Management Inc. and ATB Securities Inc. are individually licensed users of ATB Wealth. ATB Securities Inc. is a member of the Canadian Investor Protection Fund and the Canadian Investment Regulatory Organization.
ATB Investment Management Inc. (ATBIM) is registered as a Portfolio Manager across various Canadian securities commissions with the Alberta Securities Commission (ASC) being its principal regulator. ATBIM is also registered as an Investment Fund Manager who manages the ATB Funds. ATBIM is a wholly owned subsidiary of ATB Financial and is a licensed user of the registered trademark ATB Wealth.
Past performance is no guarantee of future results. Mutual Funds are not insured by the Canada Deposit Insurance Corporation, nor guaranteed by ATBIM, ATBSI, ATB Financial, the province of Alberta, any other government or any government agency. Commissions, trailing commissions, management fees, and expenses may all be associated with mutual fund investments. Read the fund offering documents provided before investing. The Compass Portfolios includes investments in other mutual funds. Information on these mutual funds, including the prospectus, is available on the internet at www.sedar.com.
The information contained herein has been compiled or arrived at from sources believed to be reliable, but no representation or warranty, expressed or implied, is made as to their accuracy or completeness, and ATB Wealth (this includes all the above legal entities) does not accept any liability or responsibility whatsoever for any loss arising from any use of this document or its contents. This information is subject to change and ATB Wealth does not undertake to provide updated information should a change occur. This document may not be reproduced in whole or in part, or referred to in any manner whatsoever, nor may the information, opinions and conclusions contained in it be referred to without the prior consent of the appropriate legal entity using ATB Wealth. This document is being provided for information purposes only and is not intended to replace or serve as a substitute for professional advice, nor as an offer to sell or a solicitation of an offer to buy any investment. Professional legal and tax advice should always be obtained when dealing with legal and taxation issues as each individual’s situation is different.
Limitation of Use: The hypothetical data in Table D is for illustrative purposes only and do not represent actual returns. No representation or warranty is made as to the reasonableness of the assumptions or that all assumptions used in the calculations have been stated or fully considered. We do not guarantee that the hypothetical return will be similar to actual performance.