
Portfolio managers' commentary
A review of Q1 2025
Volatility has weighed heavily on the markets and global economy this quarter due to erratic US trade policies and tariffs. As a result, investors shifted away from US equities, favouring international and Canadian markets.

Summary
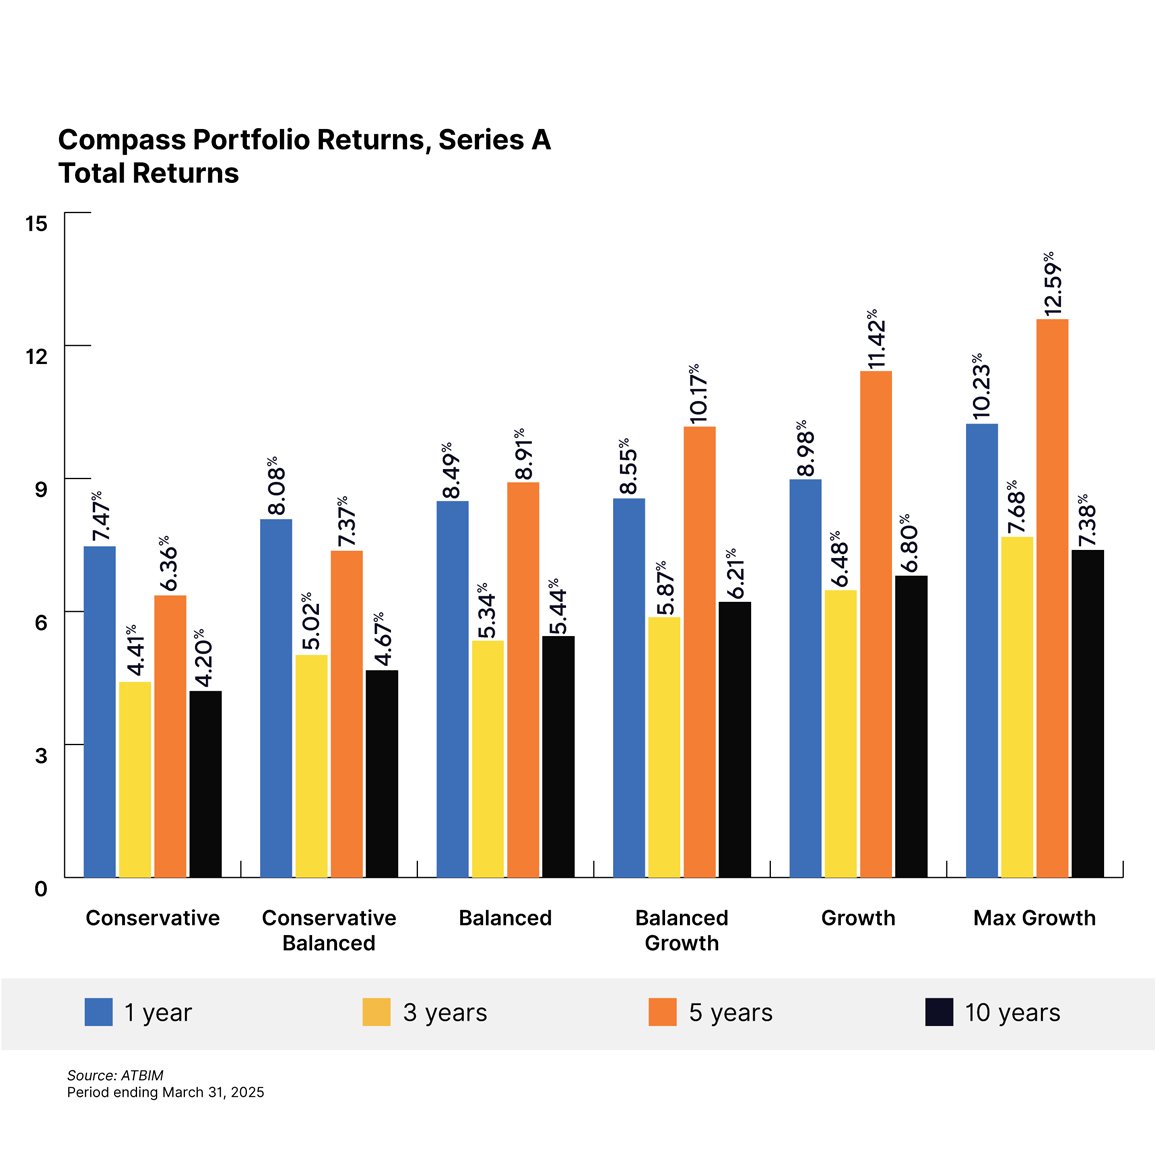
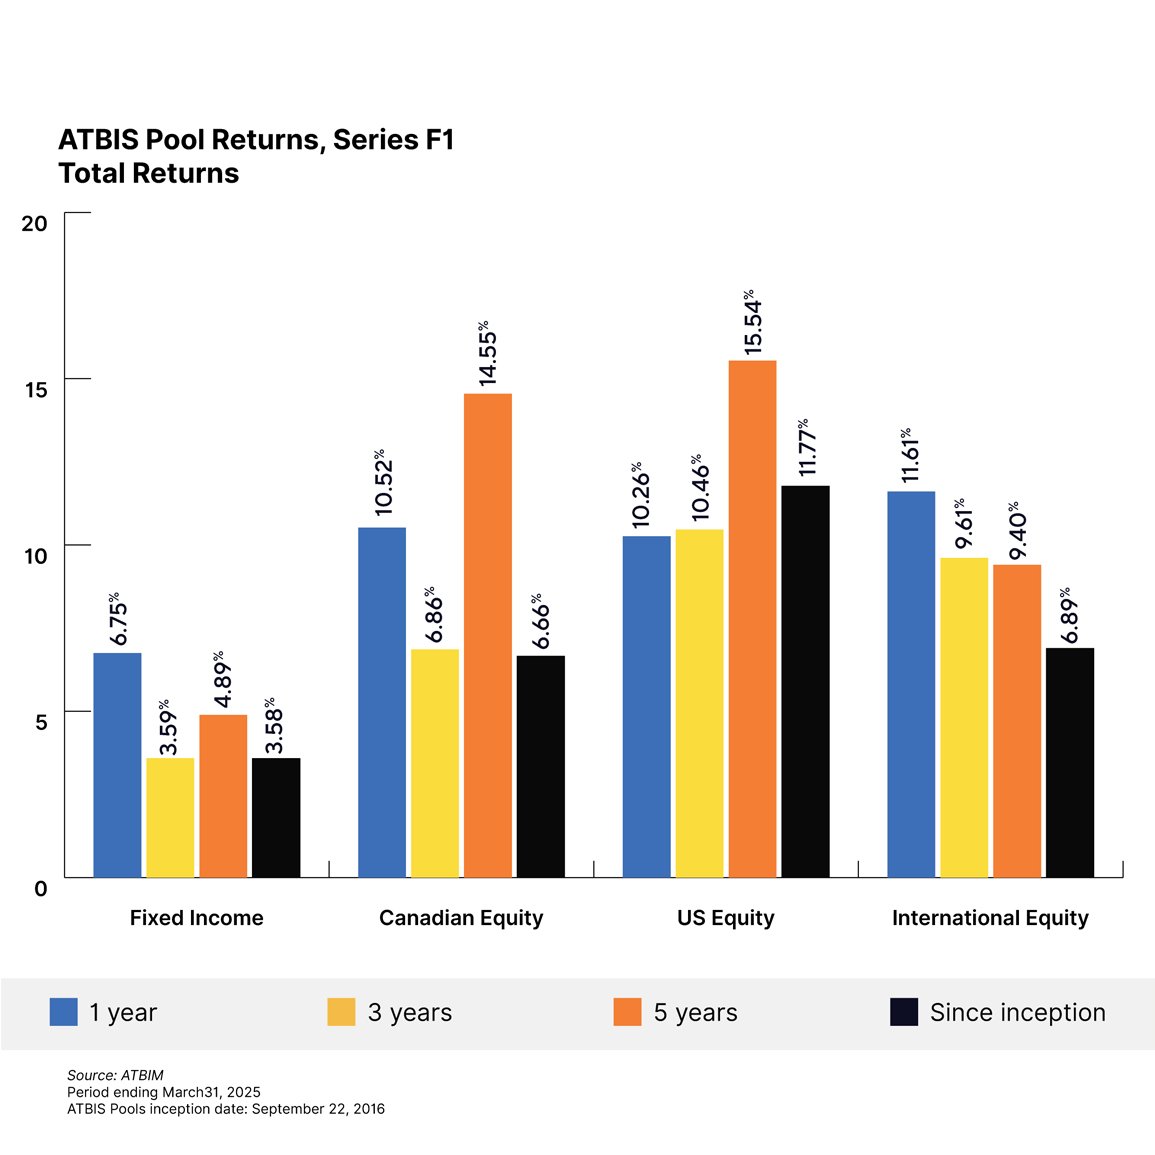
- The ATB Investment Management funds (the Funds) performed well in a difficult first quarter. The Compass Portfolios all delivered positive returns ranging from 1.5% to 2.9%. The ATBIS pools saw performance that ranged from -1.2% to 7.7%.1
- The inauguration of President Trump marked a turning point in the world, which reset market leadership, growth expectations, and global trade. The negative performance of the first quarter prompted investors to rotate away from the Magnificent Seven2 stocks and US equities. Amidst the chaos, international and Canadian equities were the beneficiaries as they advanced.
- Tariffs took the spotlight as the US administration attempted to rewrite the lines of trade. What began with additional levies on Canada, Mexico, and China quickly expanded to the rest of the world. Risk assets saw their fortunes fluctuate as trade and tariff policy announcements grew more erratic leading up to April 2, 2025, dubbed "Liberation Day" by President Trump.3
- During the quarter, the portfolios neutralized some of the tactical tilts, taking profit on gains in the international markets, while slowly building up a cash buffer. This worked out in our favour. With market direction at the whim of an unpredictable and poorly communicated trade policy, it made sense to take the foot off the gas to weather the storm.
Economics
The US administration’s tariff policy took centre stage in the first quarter, with all economic data subject to the magnitude and direction of tariff policy imposed by the US on its trading partners. President Trump announced that he was planning 25% tariffs on Canadian and Mexican imports for February 1, 2025, hours after his inauguration on January 20, 2025. These were subsequently moved to February 4, 2025 for implementation. After discussion between the three trading partners’ leaders, these were delayed yet again for 30 days the night before to the beginning of March. Since then, there have been other levies imposed on goods entering the US from Canada such as on aluminum and steel, ahead of “Liberation Day.” The volatility from the back and forth on tariffs has weighed on markets, consumers and businesses alike, as evidenced by the March US consumer sentiment dropping to the lowest level in 12 years.
Central bank policy continued to widen between the US Federal Reserve (Fed) and the Bank of Canada (BoC), with the latter cutting the overnight rate by 0.25% in January and March on slowing economic activity and continued progress on inflation. This continues the largest divergence the central banks have had on their respective overnight rates since 1997, and given the economic backdrop of Canada versus the US, the degree to which they are diverging is not surprising. On a going-forward basis, the US risks inflation spiking due to higher prices on imported goods from tariffs, leading to the Fed holding rates or being cautious. Canada’s economic growth, on the other hand, has been lacklustre compared to the US and doesn’t have as high of a threat of tariffs driving prices up, leading to the BoC being more willing to cut rates. While the rate differential has some effect on the currency, there are a multitude of other factors at play, such as future inflation and growth expectations that have been playing a significant role as well.
The unfortunate reality is that the positive economic data of the past quarter was overshadowed by the scale of tariff announcements. The larger concern for market observers will be if the backward-looking economic data that was unaffected by the US’s new tariffs is weak. A stagnant economy going into the new tariff regime has less buffer to counteract any higher prices in the short term that are likely to arise from the import levies.
Markets
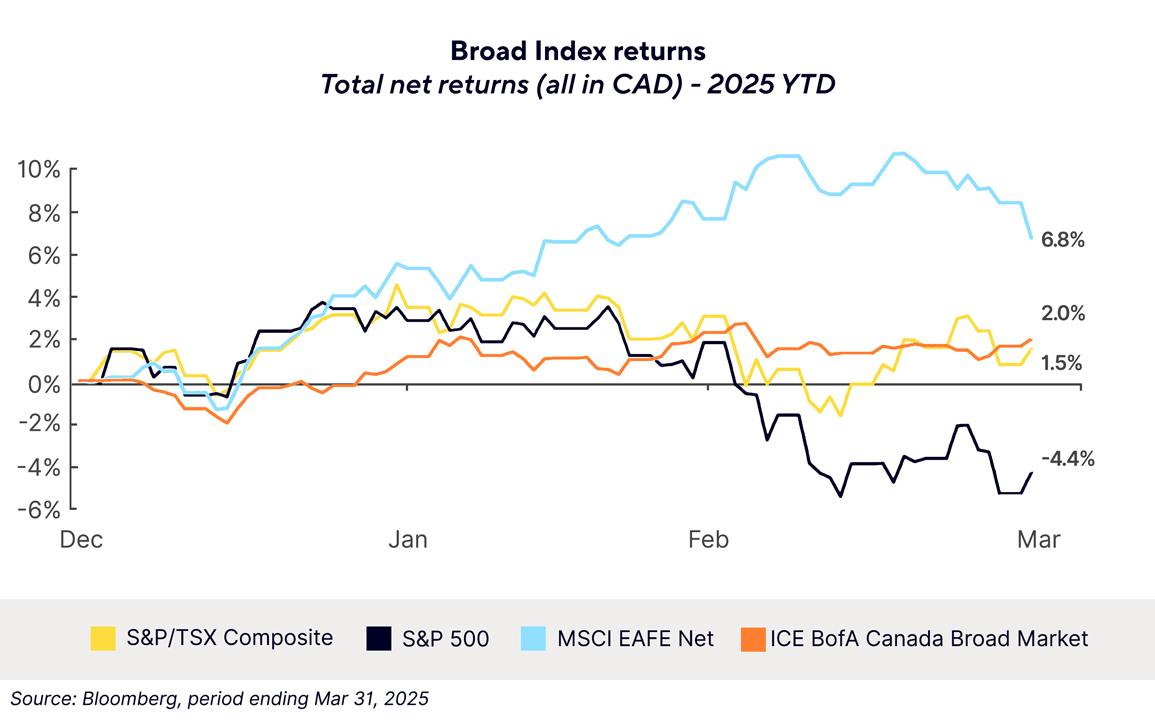
Equity markets worldwide saw notable divergence between the major geographical regions, with the US market underperforming most of its global peers as ambiguity around tariff policy weighed on US stocks. Hardest hit were the Magnificent Seven stocks, falling just under 16% versus the S&P 500 index falling just over 4%, both in USD terms. Poor performance was concentrated within the higher flying names within the US market, as the S&P 500 equal weighted index—which takes the impact of the largest stocks in the US index and equalizes their impact with the smallest, only fell 0.6% for the quarter.
Canadian markets were slightly positive over the quarter, with performance being driven by gold and energy stocks, which was offset by weakness from the financials and information technology sectors. Earnings were still positive overall in the previous earnings season, but there were pockets of weakness within industrials and energy names. Canadian stocks appear to be in a sort of limbo, as investors are likely awaiting more clarity on US tariffs and the result of the election in late April. Until then, there is unlikely to be any significant action from the federal government regarding actionable policy to help support Canadian trade, so investors are likely waiting on the sidelines.
International stocks, as broadly measured by the MSCI EAFE index, outperformed their Canadian and US counterparts, primarily driven by European—in particular German—equities. In response to a perceived shift in US foreign policy away from Europe, Germany announced and passed a fiscal stimulus plan in March encompassing increases in defence and infrastructure spending worth 500bn Euros. The passing of this budget gave substance to the outperformance in European and German equities that had been building gradually over the quarter. By the end of March, European equities, as measured by the MSCI Europe index, rose by 10.7% on a Canadian dollar basis, significantly outperforming the US market. The holdings within the portfolios that hold international equities were significant beneficiaries of the European stimulus, as we are currently favouring international stocks over their US counterparts.
Bonds were not immune to volatility as yields rose in early January, with economic data suggesting the possibility for central bank cuts to be pushed back. Bond prices recovered quickly as markets pivoted later in the quarter amidst tariff uncertainty pushing rates down. Yields in Canada overall fell roughly 0.25% as measured by the FTSE Canada Bond Universe Index, leading to a positive month overall. Performance varied between shorter and longer maturity bonds, as yields fell more in shorter maturity bonds versus those with longer maturities—a reflection of the BoC cutting rates by 0.25% twice during the quarter, and likely some concern over inflation resulting from tariff implementation. Corporate and high yield bond spreads also rose over the quarter, leading to them underperforming their government alternatives. The fixed income within the portfolio is biased towards a lower duration, benefitting from the movement in yields, but performance was slightly offset on a relative basis by the higher allocation to non-government bonds.
Conclusion
The past quarter has shown that patience is key, and policies can change sometimes on an intraday basis. The significant rise in policy uncertainty remains top of mind for market participants, especially after the “Liberation Day” tariff announcement. Going forward, it is still important to keep a long-term mindset when investing, even if there are short-term hurdles that may have long-term consequences. Performance on a year-to-date basis showcases why diversification is important, even if one market has been dominating performance over a longer time horizon.
There are still many questions that remain unanswered with respect to tariff policy. China has responded aggressively to the US administration’s blanket tariffs by imposing tariffs of 34% on US goods, and there have already been some threats to raise tariffs on Chinese goods in response. There will likely be continued retaliatory tariffs, likely leading to more volatility in markets. What ultimately ends up sticking is currently unknown, and from a longer-term perspective, there will be winners and losers, but a well-constructed and diversified portfolio is one of the best ways to weather the storm in which we find ourselves.
1 Compass Portfolio Total Returns for series A, and ATBIS FI Pool Total Returns for series F1. Fund returns for all series can be found on atbim.atb.com/funds
2 "The Magnificent 7"—Apple, Amazon, Alphabet, Meta, Microsoft, Nvidia and Tesla
3 Associated Press. (March 31, 2025) Trump’s promised ‘Liberation Day’ of tariffs is coming.
ATB Investment Management Inc. (ATBIM) is registered as a Portfolio Manager across various Canadian securities commissions with the Alberta Securities Commission (ASC) being its principal regulator. ATBIM is also registered as an Investment Fund Manager who manages the ATB Funds. ATBIM is a wholly owned subsidiary of ATB Financial and is a licensed user of the registered trademark ATB Wealth.
The performance data provided assumes reinvestment of distributions only and does not take into account sales, redemption, distribution or optional charges or income taxes payable by any security holder that may reduce returns. Unit values of mutual funds will fluctuate and past performance may not be repeated.
Mutual Funds are not insured by the Canada Deposit Insurance Corporation, nor guaranteed by ATBIM, ATB Securities Inc. (ATBSI), ATB Financial, the province of Alberta, any other government or any government agency. Commissions, trailing commissions, management fees, and expenses may all be associated with mutual fund investments. Read the fund offering documents provided before investing. The ATB Funds, Compass Portfolios, and ATBIS Pools include investments in other mutual funds. Information on these mutual funds, including the prospectus, is available on the internet at www.sedarplus.ca.
Past performance is not indicative of future results. Opinions, estimates, and projections contained herein are subject to change without notice and ATBIM does not undertake to provide updated information should a change occur. This information has been compiled or arrived at from sources believed reliable but no representation or warranty, expressed or implied, is made as to their accuracy or completeness. ATB Financial, ATBIM and ATBSI do not accept any liability whatsoever for any losses arising from the use of this report or its contents.
This report is not, and should not be construed as an offer to sell or a solicitation of an offer to buy any investment. This report may not be reproduced in whole or in part; referred to in any manner whatsoever; nor may the information, opinions, and conclusions contained herein be referred to without the prior written consent of ATBIM.