
Portfolio managers' commentary
A review of Q2 2023
Economic growth remains robust in Q2

Summary
- All ATB Investment Management funds (the funds) saw positive overall performance for the second quarter of 2023. Total returns for the six Compass Portfolios ranged from 0.5% to 2.1%, and the four ATBIS Pools ranged from 0.5% to 4.2%.1
- Inflation is moderating yet core prices remain sticky in the US. Labour markets and wage growth also remain tight and elevated which has left the door open for further rate hikes.
- While we still see the potential for equities to continue to run higher, the increasingly expensive valuations in the US combined with headwinds from further key rate increases, led us to trim equities back to a neutral position within the Compass Portfolios.
- Slower growth in China could be the main culprit for falling commodity prices. The Manufacturing Purchasing Managers Index (PMI) for China declined materially from March levels showing contraction in all of the last three months. Prices for oil, industrial and precious metals have all declined through the quarter.
Compass Portfolio Returns, Series A - Total Returns as at June 30, 2023
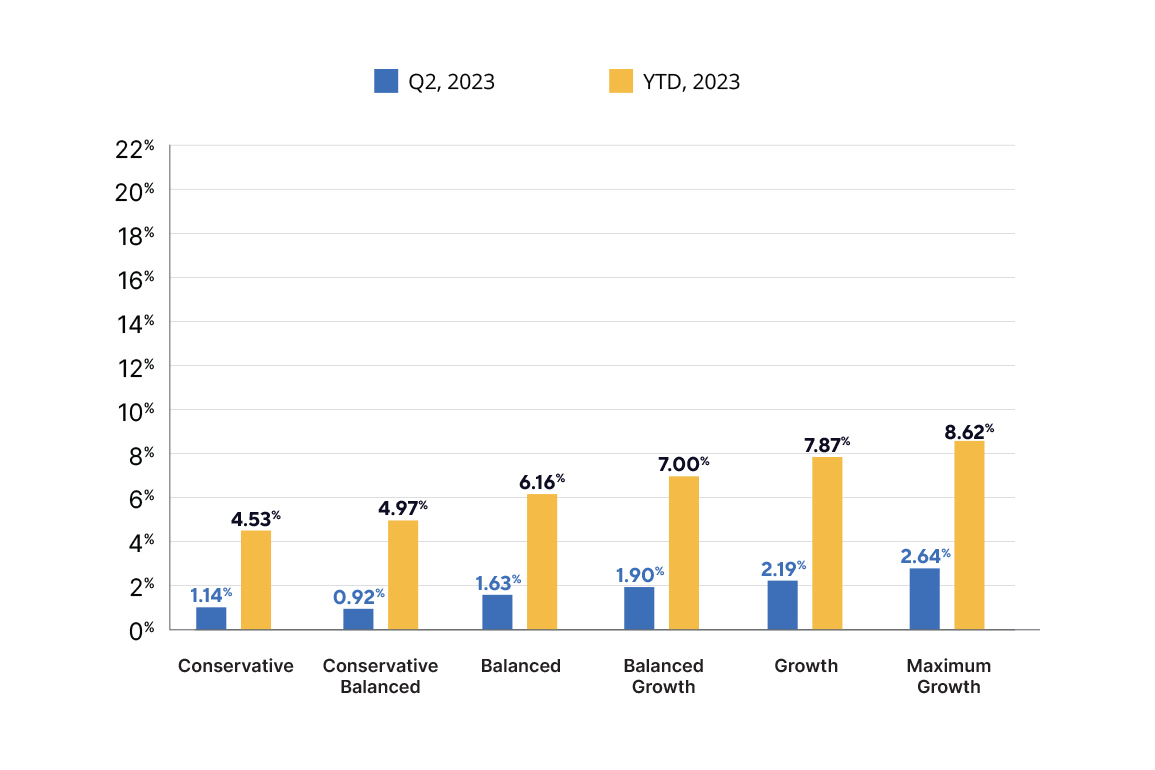
Source: ATB Investment Management Inc.
Time periods greater than 1 year are annualized.
ATBIS Pool Returns, Series F1 - Total Returns as at June 30, 2023
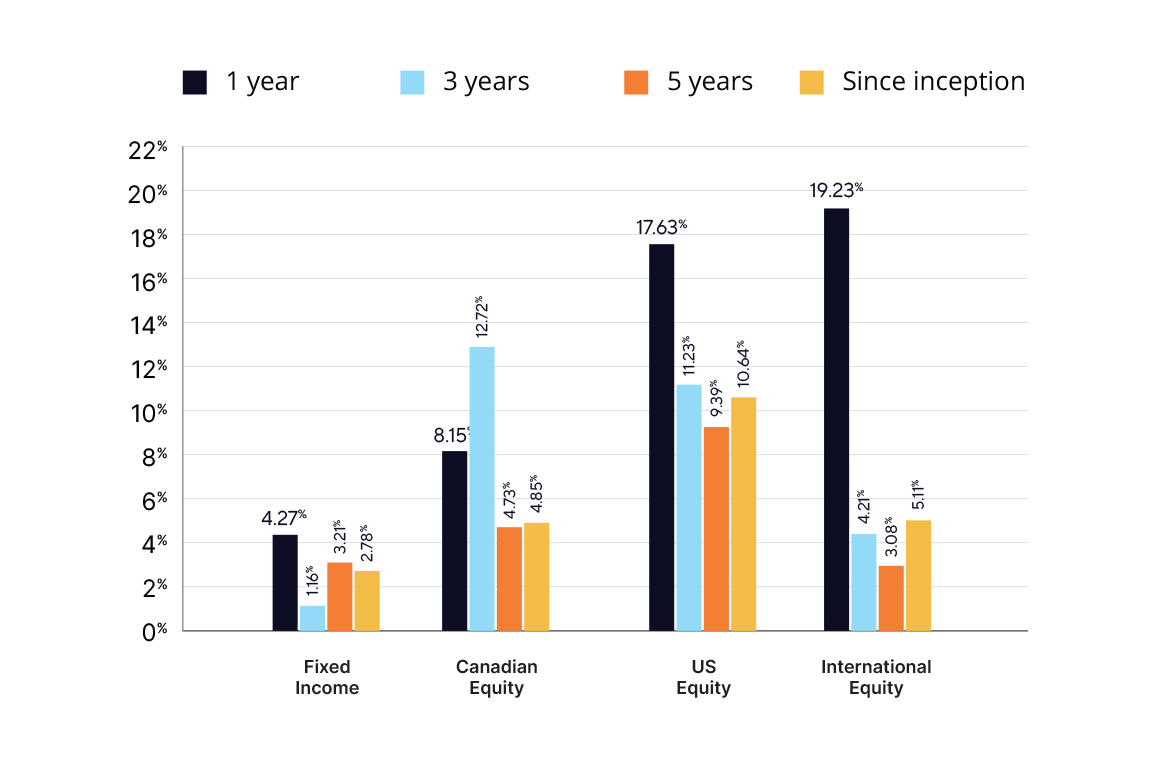
Source: ATB Investment Management Inc.
Time periods greater than 1 year are annualized. Since inception September 30, 2016.
Economy
The second quarter saw a flurry of activity from central banks globally, as economic growth remained robust with core inflation rates falling slower than target. The Bank of Canada (BoC) surprised the market with a rate hike in June of 0.25% amid headline inflation that continued to moderate due to falling commodity prices, with energy sliding more than 12% on an annual basis. Additional factors included falling core measures that were still higher than target, and persistent economic growth—at 3.1% on an annualized basis for Q1. Despite the May inflation reading of 3.4%—published in late June—falling to the lowest rate since June 2021, markets still expect one more rate hike this year, likely in the fall. This is due to a resilient labour market—although it has begun to show some weakening demand—coupled with continued economic growth. A quick look at other measures, such as inflation excluding interest payments—which has fallen to 2.5%—and inflation ex-shelter (shelter accounts for ~30% of the basket) falling to 2.8%, has some saying the bank should stop.
The economic picture was similar for the US. The Federal Reserve (the Fed) raised rates at their May meeting as core inflation was slowly coming down but staying above 5%, the strong jobs market is starting to show some moderation, and wages outpace inflation. As with Canada, markets are expecting one more hike this year, as the Fed is expecting economic growth to slow, with GDP growing approximately 1% for 2023 compared to growth for Q1 2023 at 2% annualized. It remains to be seen whether these forecasts hold, as sticky core inflation and wage growth may prove to be a bigger thorn in the Fed’s side than anticipated.
The impact of the debt ceiling issue was largely limited to equity and fixed income market volatility. A resolution reached in early June brought about its suspension until 2025. This brings stability to the budgetary process over the next couple years, hopefully minimizing any further market or economic impacts from congressional-related disagreements.
US and Canada inflation (%)
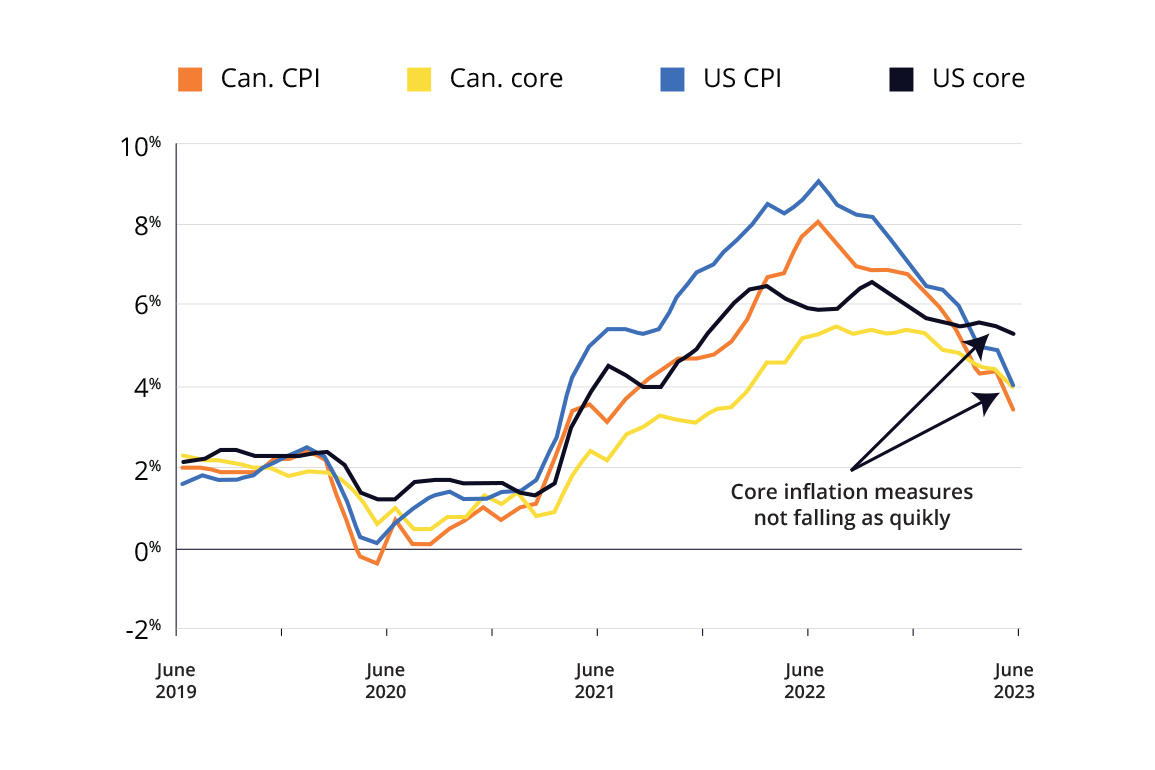
Source: Statcan, Bureau of Labour Statistics
Developed markets globally—especially those in Europe and the UK—are continuing to fight stubbornly high, but falling inflation. The Bank of England (BoE) faces a mammoth task as, while inflation is down from its 11.1% peak in October 2022, it is still at 8.7% for May as prices for almost all categories remain elevated. As the BoE is likely to hike further and for longer, those with variable mortgages—about 20% of mortgages2—and renewals will be hit particularly hard, likely causing turbulence in the housing market. This in turn could exacerbate any knock-on effects from rising rates, and eliminate hopes of a soft landing. In the EU, where inflation is 6.1% for May (down from around 10% in October) core measures are down to 5.3%, but this highlights a possible sustained divergence in policy between North American and European central banks, as the latter may need to hold rates higher for longer.
Markets
As the Canadian economy remains resilient and we saw another rate hike over the quarter, yields rose in Canada from 3.95% to 4.37%.3 Another potential quarter point hike is expected for the July or September meeting. Credit spreads, or the additional yield one can get on a riskier corporate bond compared to a risk-free government bond, narrowed slightly over the quarter supporting corporate bond prices. Higher overall yields with narrowing spreads led to better relative performance for the funds which continue to be shorter duration and tilted towards credit compared to the broader Canadian bond market. The fund’s fixed income component returned 0.6% for the quarter compared to -0.7% for the FTSE Canada Universe index and carries a blended yield of about 6.2%.
Broad equity and Canadian bond total return (all in CAD terms) - 2023 YTD
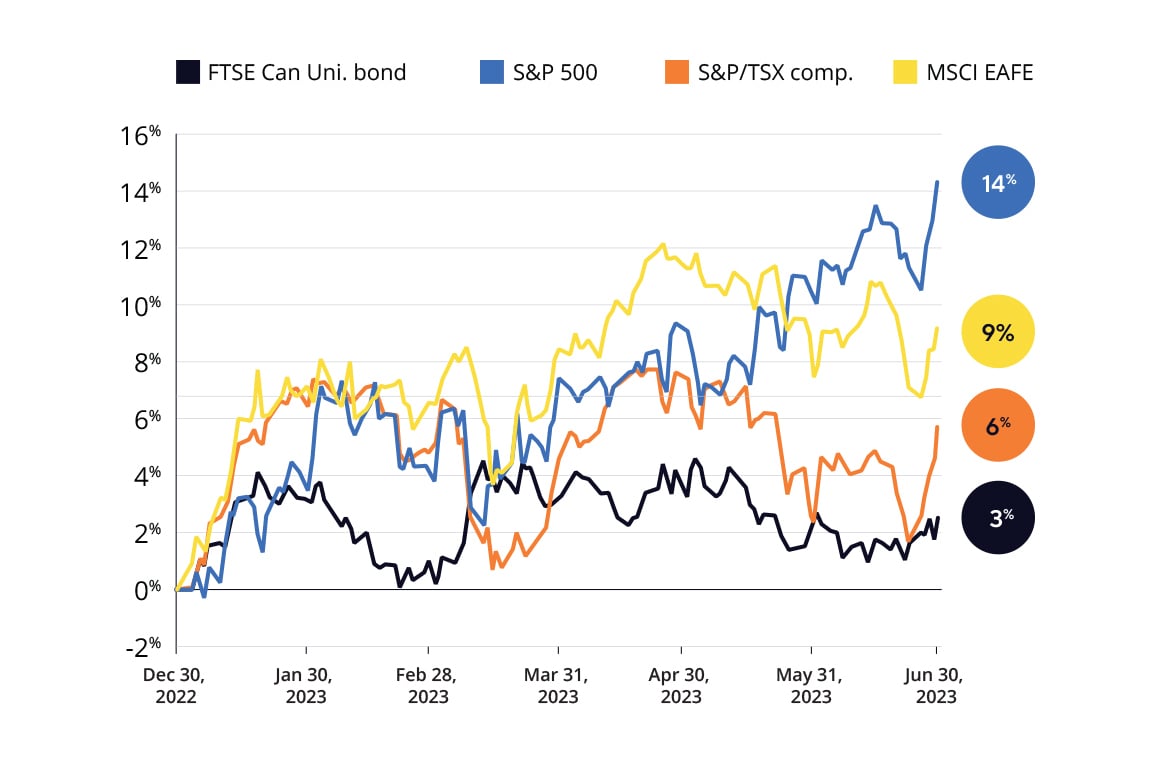
Source: Bloomberg
For equity markets over the quarter, US large cap equities led the way and returned 6.4% in Canadian dollar terms. The artificial intelligence theme, in particular, has fueled technology and related companies, and the US has benefited from having the highest concentration of these types of companies globally. The information technology sector of the S&P 500 ended the quarter at about 30 times earnings, up 50% from the end of 2022 and only slightly less expensive than at the end of 2021. The fund’s US equities returned about 4.2% over the quarter as a result of holding relatively less weight in the higher valued info tech sector.
Canadian equity markets, in a continuation from the first quarter, have been hampered by moderating commodity prices. Declining base and precious metals prices drove the materials sector down 7% this quarter. In contrast, the technology sector on the TSX Composite Index followed the US appreciating 16% although the sector is much smaller for the TSX at 8% compared to 28% for the S&P 500. Overall with a lower Canadian tech exposure in the funds—in particular, not holding Shopify—the funds lagged the TSX by half a percent returning 0.6% over the quarter.
Lastly on international equity markets, the MSCI EAFE index was mostly flat for the quarter, up about 0.7% compared to the funds’ international holdings returning 1.0% overall. Slightly better performance can be attributed to better performing small-cap equities. Revenue and earnings growth internationally has been quite strong this year, increasing about 11% for both since the end of 2022 for the MSCI EAFE index. This has left international stocks as the only developed region this year to become more attractive on a valuation basis. We continue to overweight this region within the fund's equity holdings.
Moving to neutral
Equity markets have moved upward this year, but not all markets have been supported by growing earnings. The US equity market in particular has the average stock up about 17% since the start of the year4, yet earnings are virtually unchanged. The earnings yield on US stocks are barely above a government bond and looking relatively more expensive than they were six months ago. In fact this is the lowest premium over treasuries US stocks have had since the mid 2000’s. Stock earnings can grow at a faster rate to justify higher prices both in real terms and from passing along inflation, but growth is difficult to forecast and may not materialize. In light of this, towards the end of the quarter we began to trim some stock holdings in favour of bonds, moving the funds back to a neutral position. We had been overweight in stocks since the COVID market decline in March 2020.
Closing remarks
The market can always surprise. It’s a possibility that we find ourselves in a mid-90s era equity bull market again with artificial intelligence becoming the new reason to cast normal valuation metrics aside. Should that occur, the funds positioning can be adjusted to be more defensive–US stocks are still of relatively good value compared to the 2000 peak. In the meantime, we follow a similar playbook to the last time the funds were moved to a neutral positioning–during September of 2018 when the backdrop seemed similar to today. Then, similar to today, central banks had been raising interest rates for some time, equity prices had been climbing and relative valuations were no longer as attractive. The potential for economic slowdown is present which can always be a catalyst for volatility.
1 Compass Portfolio Total Returns for series A, and ATBIS FI Pool Total Returns for series F1
2 November 2022 Bank of England Monetary Policy Report
3 FTSE Canada Universe Index Yield from March 31, 2023 to June 30,2023
4 S&P 500 Index total return of 16.9% for 2023 through to June 30.
This report has been prepared by ATB Investment Management Inc. (ATBIM). ATBIM is registered as a Portfolio Manager across various Canadian securities commissions with the Alberta Securities Commission (ASC) being its principal regulator. ATBIM is also registered as an Investment Fund Manager who manages the Compass Portfolios and the ATBIS Pools. ATBIM is a wholly owned subsidiary of ATB Financial and is a licensed user of the registered trademark ATB Wealth.
The performance data provided assumes reinvestment of distributions only and does not take into account sales, redemption, distribution or optional charges or income taxes payable by any security holder that may reduce returns. Unit values of mutual funds will fluctuate and past performance may not be repeated. Mutual Funds are not insured by the Canada Deposit Insurance Corporation, nor guaranteed by ATBIM, ATB Securities Inc. (ATBSI), ATB Financial, the province of Alberta, any other government or any government agency. Commissions, trailing commissions, management fees, and expenses may all be associated with mutual fund investments. Read the fund offering documents provided before investing. The Compass Portfolios includes investments in other mutual funds. Information on these mutual funds, including the prospectus, is available on the internet at www.sedar.com.
Past performance is not indicative of future results. Opinions, estimates, and projections contained herein are subject to change without notice and ATBIM does not undertake to provide updated information should a change occur. This information has been compiled or arrived at from sources believed reliable but no representation or warranty, expressed or implied, is made as to their accuracy or completeness. ATB Financial, ATBIM and ATBSI do not accept any liability whatsoever for any losses arising from the use of this report or its contents.
This report is not, and should not be construed as an offer to sell or a solicitation of an offer to buy any investment. This report may not be reproduced in whole or in part; referred to in any manner whatsoever; nor may the information, opinions, and conclusions contained herein be referred to without the prior written consent of ATBIM.