
Quarterly commentary
A review of Q2 2025
US trade policy uncertainty initially impacted markets, but strong economic performance and a resurgence in growth-oriented stocks led to a rebound. However, a declining US dollar reduced gains for foreign investors.

Summary
- The ATB Investment Management Funds (the Funds) performed well over the second quarter. The Compass Portfolios all delivered positive returns ranging from 0.5% to 5.1%. The ATBIS Pools saw performance that ranged from 0.5% to 8.9%1.
- US trade policy was front and centre, as the “liberation day” tariff announcements and the subsequent turbulence in policy had markets guessing on next steps, leading to equities falling early in the quarter, but ending the quarter in positive territory.
- While the US markets lagged other regions in the quarter on Canadian dollar basis, the US economy has been firing on all cylinders. The portfolios took advantage of this opportunity by rotating to the US from international equities. Hints of a US rebound came at the back half as growth-oriented stocks made a resurgence, which benefited the portfolio.
- The US dollar continued its decline versus peer currencies, including the Canadian dollar, reducing returns for foreign investors in US markets.
Economics
US trade policy continued to be in focus during the quarter, with the US administration’s “liberation day" unveiling the highest levies on trading partners since at least the 1930s2. Policy uncertainty peaked when tariffs between China and the US reached more than 100% on both sides, resulting in a de facto trade embargo. Tensions and tariff levels de-escalated, but still remain higher than previous levels. While reciprocal tariffs have been lowered to a broad 10% baseline, the relief is a temporary pause meant to expire in 90 days. Progress on trade deals has been slow, likely foreshadowing heightened trade policy volatility leading up to the tariff relief deadline.
The full economic impact of tariffs has yet to be determined over the long run, but a spike in US imports with companies looking to get ahead of the tariffs saw US gross domestic product (GDP) contract in Q1. The US economy appears to have reversed much of that contraction with the Q2 data, with preliminary data suggesting Q2 GDP growing over 2%.
Despite some evidence pointing to a slowing economy, the Federal Reserve (Fed) has been reluctant to move policy rates, citing a strong labour market, and expected inflation flow-through to goods from tariffs. With the Fed policy sitting at 4.5% as of June 30, the Fed policy rate is amongst the highest in the world and has been one of the lone holdouts to cut rates in 2025. The European Central Bank (ECB) has cut policy rates multiple times this year, along with the Bank of Canada (BoC). Back at home, after cutting multiple times earlier in the year, the BoC held off in Q2 and left the overnight rate at 2.75% citing sticky core inflation, but signalled a willingness to cut if the economy weakens. That weakness may show up sooner than later, as GDP estimates for April and May show a contraction in economic activity.
Markets
Equity markets rallied worldwide over the quarter despite a turbulent April, as trade policy stabilized and US trading partners got a temporary reduction in tariffs to encourage trade deals. US markets were led by growth-oriented parts of the market, with information technology rising just under 24% over the quarter, boosted by familiar names such as Nvidia and Microsoft. Market performance was concentrated in the sector, as roughly 7% of the S&P 500’s 10.9% rise over the quarter was due to technology stocks. One aspect of the US market that has shown incredible resilience is earnings. While growth expectations for this year have been pared back amid the turbulence in trade policy, they have continued to grow and are expected to end the year higher versus their international counterparts, who are expecting limited growth.
One part of the market that has been somewhat overshadowed for mainstream investors by rallying equities and policy turbulence is the decline of the US dollar. Despite strong performance from the US market overall, international investors in US stocks saw their gains limited by a falling US dollar. The depreciation of the currency was broad-based, losing more than 8% vs the Euro, and just under 6% vs the Canadian dollar during the quarter. This is in addition to the deterioration the USD saw versus its developed peers in Q1, bringing the total decline to over 10% on a year-to-date basis using the ICE US Dollar Index. The decline of the dollar has largely been attributed to the “anywhere but US” trade causing international investors to divert funds towards other markets.
Markets outside of the US continued to outperform American markets throughout the quarter on a Canadian dollar basis, with Canada being a notable outlier, rising just over 8.5% over the quarter, versus other developed markets such as Europe and Japan, which averaged around 6%. Despite a sluggish outlook on the economy, the S&P/TSX index hit a record high in June, with broad-based gains across all sectors within the quarter. Financials were the main driver of index performance this quarter, outshining the luster of gold from last quarter, likely due to a commitment from the federal government to “make Canada investable again”. A similar promise has also lit a fire under European stocks, with policymakers pledging to relax sovereign debt restrictions in order to increase defense spending and the creation of a ‘savings and investments union’ to promote capital markets. As with any political promises, especially within Europe, it remains to be seen what will actually come to fruition, but at least the political will to move these ideas forward is stronger given a less friendly foreign US policy.
Bond markets in Canada saw some volatility over the quarter primarily from the ‘liberation day’ tariffs announcement and spillover from the poorly received long Japanese bond auction in late May. Rates across all bond maturities were on the move, although bonds with longer maturities were affected the most. Yields moved 0.18% higher by the end of the quarter, leading to bonds posting a modest 0.6% loss as measured by the FTSE Canada Universe Bond Index. Corporate bonds and those with a shorter duration were the winners during the quarter, thanks to a shorter duration and spread compression by the end of June after rising amid tariff uncertainty. Yields on shorter maturity bonds are in somewhat of a limbo, as their rate path is more reliant on the direction of the overnight rate, which the BoC has been holding firm. High yield bonds saw the largest move in spreads, rising to over 460 basis points post liberation day, and then falling to just under 300 basis points by the end of June. This is around the same level they started the year at, and resulted in high yield bonds being the best performing part of the bond market on a year-to-date basis.
Conclusion
The past quarter once again showcased that patience is key in volatile times. If one were to look at market performance on a purely quarterly basis, it’s almost as if the quarter was quite uneventful. We know that not to be the case, but it showcases the need to stay the course when investing in markets despite changes in market dynamics that seem to be accelerating. It’s important to recognize that there is still heightened uncertainty surrounding US trade policy as the deadline of the 90 day pause on reciprocal tariffs draws near, and trade deals are few. As the two previous quarters have demonstrated, it’s vital to keep cash at work in a well-diversified manner, as the outcome of the new regime in world trade in which we find ourselves is not yet clear.
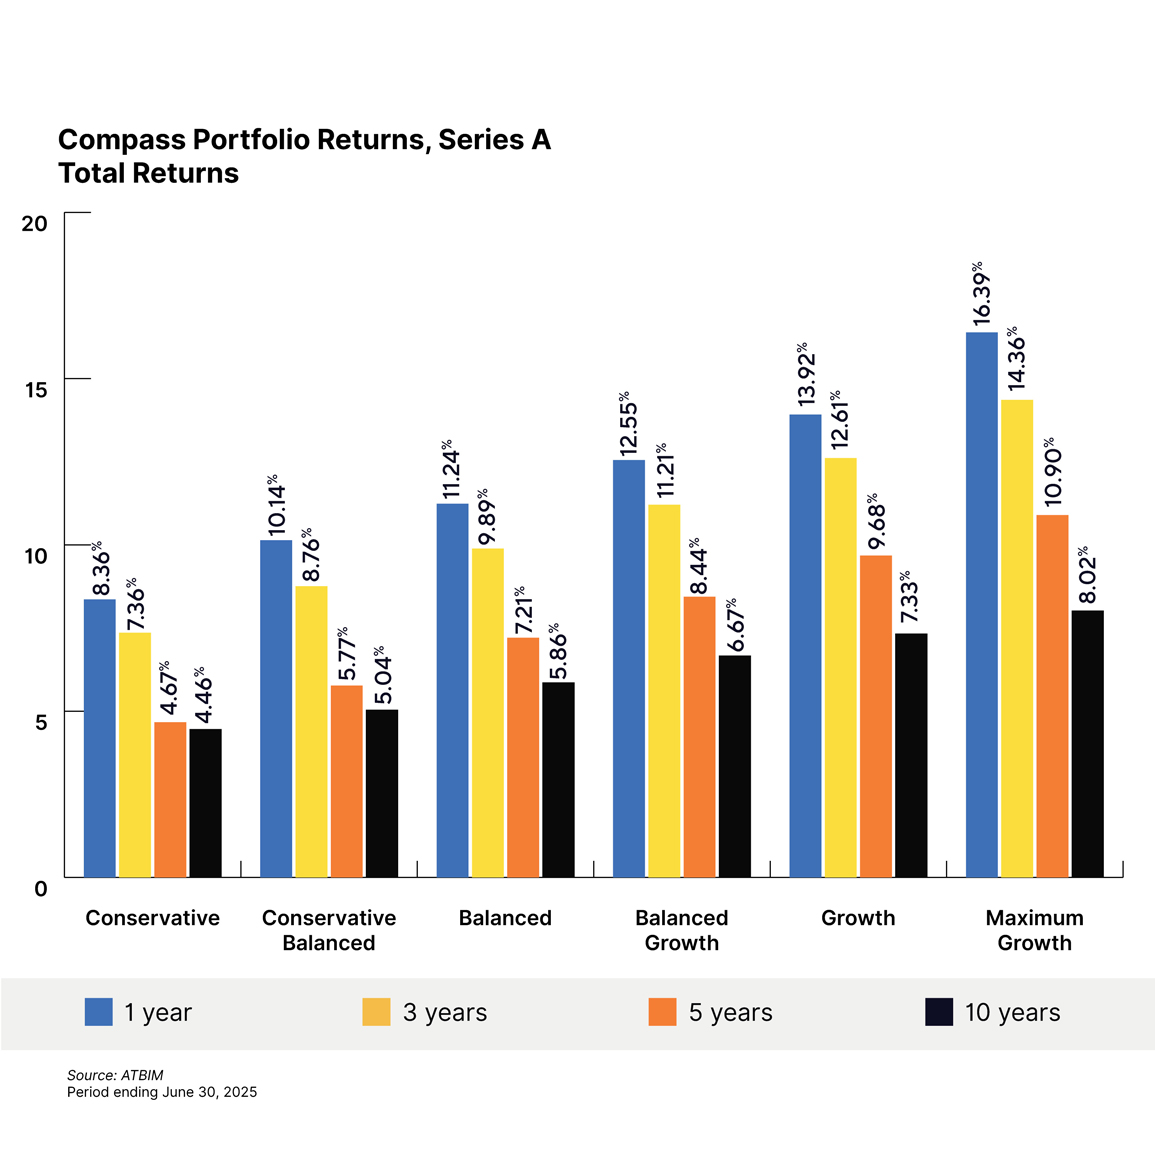
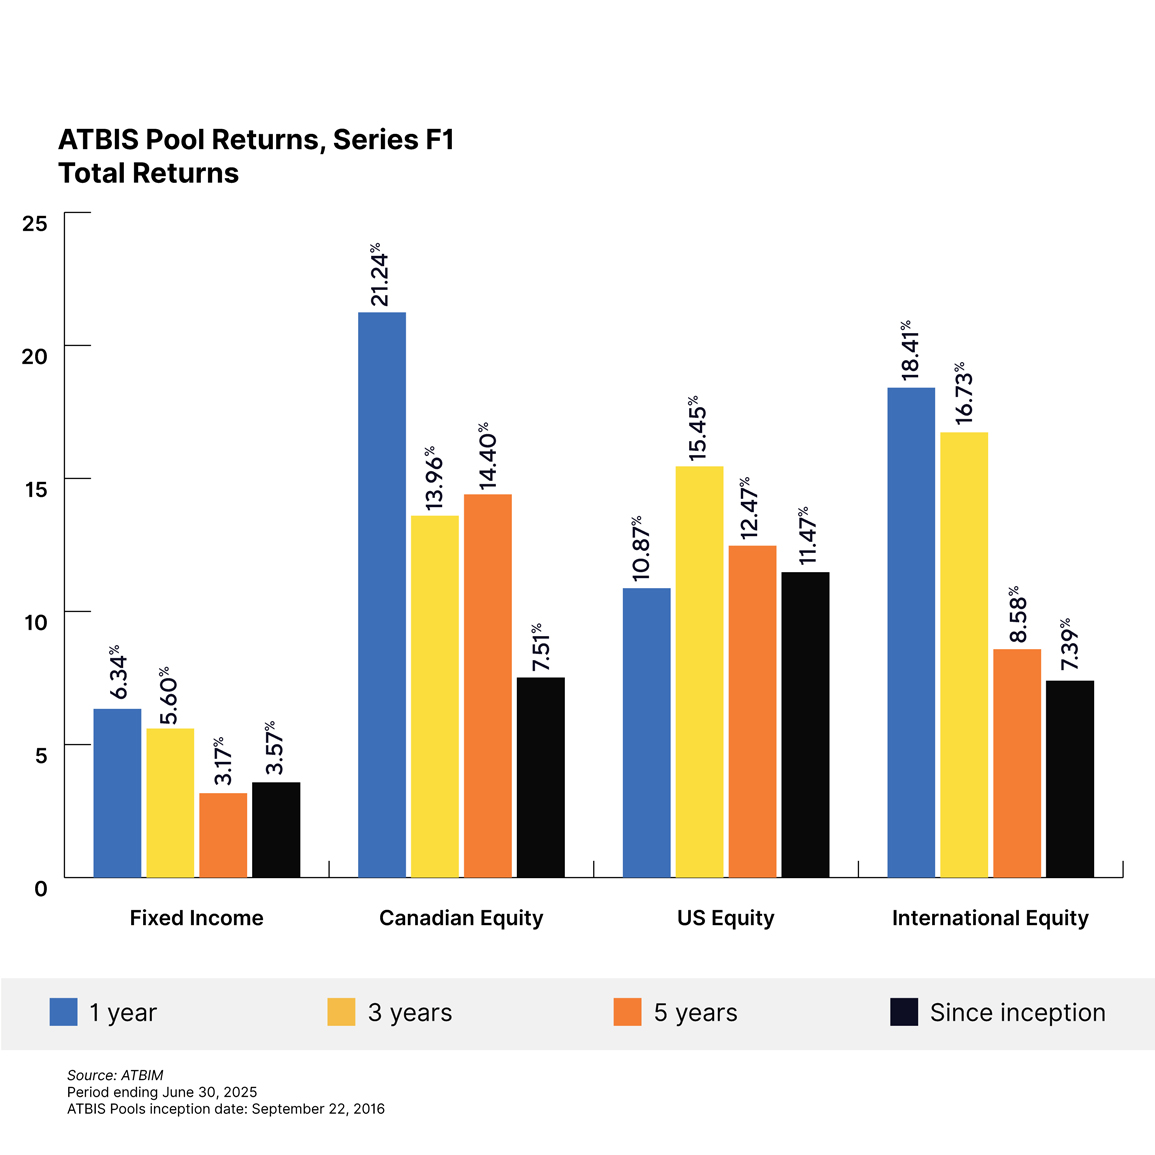
1 Compass Portfolio Total Returns for series A, and ATBIS FI Pool Total Returns for series F1. Fund returns for all series can be found on atbim.atb.com/funds
2 https://budgetlab.yale.edu/research/state-us-tariffs-april-15-2025
This report has been prepared by ATB Investment Management Inc. (ATBIM). ATBIM is registered as a Portfolio Manager across various Canadian securities commissions with the Alberta Securities Commission (ASC) being its principal regulator. ATBIM is also registered as an Investment Fund Manager who manages the ATB Funds, Compass Portfolios and the ATBIS Pools. ATBIM is a wholly owned subsidiary of ATB Financial and is a licensed user of the registered trademark ATB Wealth.
The performance data provided assumes reinvestment of distributions only and does not take into account sales, redemption, distribution or optional charges or income taxes payable by any security holder that may reduce returns. Unit values of mutual funds will fluctuate and past performance may not be repeated.
Mutual Funds are not insured by the Canada Deposit Insurance Corporation, nor guaranteed by ATBIM, ATB Securities Inc. (ATBSI), ATB Financial, the province of Alberta, any other government or any government agency. Commissions, trailing commissions, management fees, and expenses may all be associated with mutual fund investments. Read the fund offering documents provided before investing. The ATB Funds, Compass Portfolios, and ATBIS Pools include investments in other mutual funds. Information on these mutual funds, including the prospectus, is available on the internet at www.sedarplus.ca.
Past performance is not indicative of future results. Opinions, estimates, and projections contained herein are subject to change without notice and ATBIM does not undertake to provide updated information should a change occur. This information has been compiled or arrived at from sources believed reliable but no representation or warranty, expressed or implied, is made as to their accuracy or completeness. ATB Financial, ATBIM and ATBSI do not accept any liability whatsoever for any losses arising from the use of this report or its contents.
This report is not, and should not be construed as an offer to sell or a solicitation of an offer to buy any investment. This report may not be reproduced in whole or in part; referred to in any manner whatsoever; nor may the information, opinions, and conclusions contained herein be referred to without the prior written consent of ATBIM.