Portfolio managers' commentary
A review of Q3 2023
While the first half of the year seemed to be improving on the issues that arose in 2022, Q3 has provided some moments of trepidation.

Summary
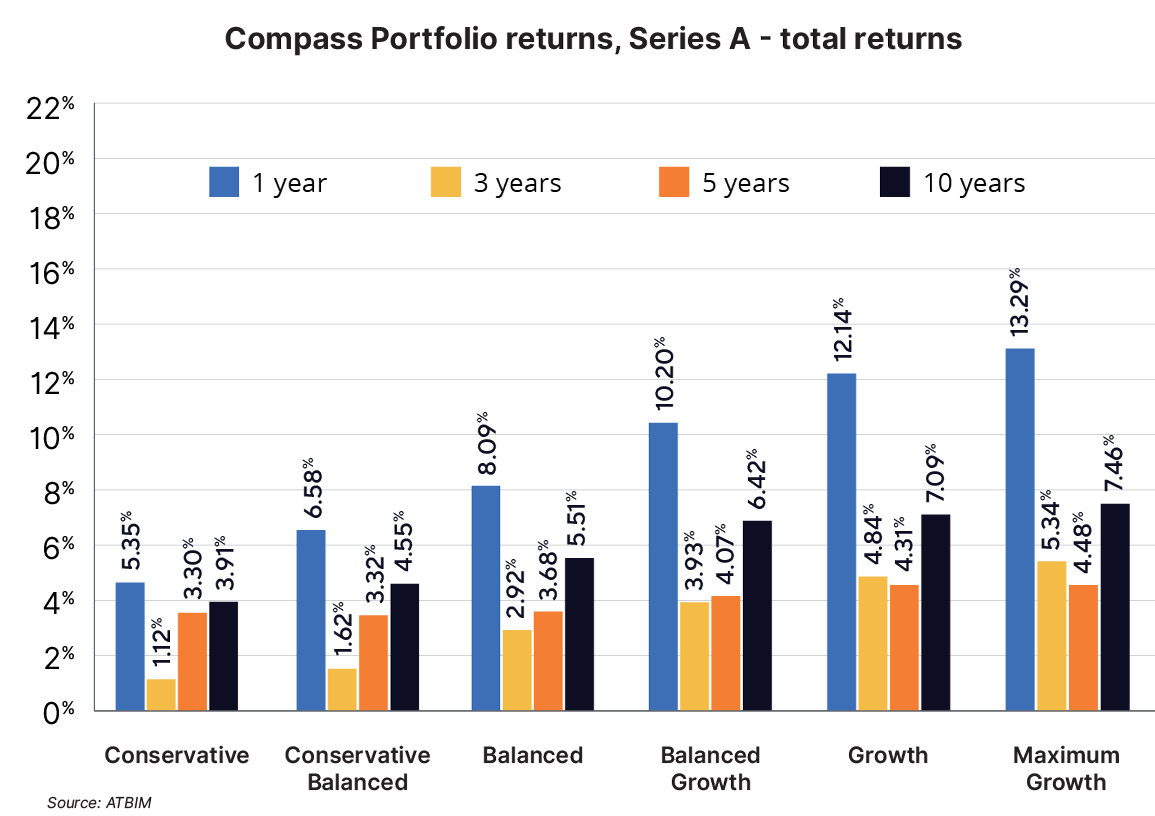
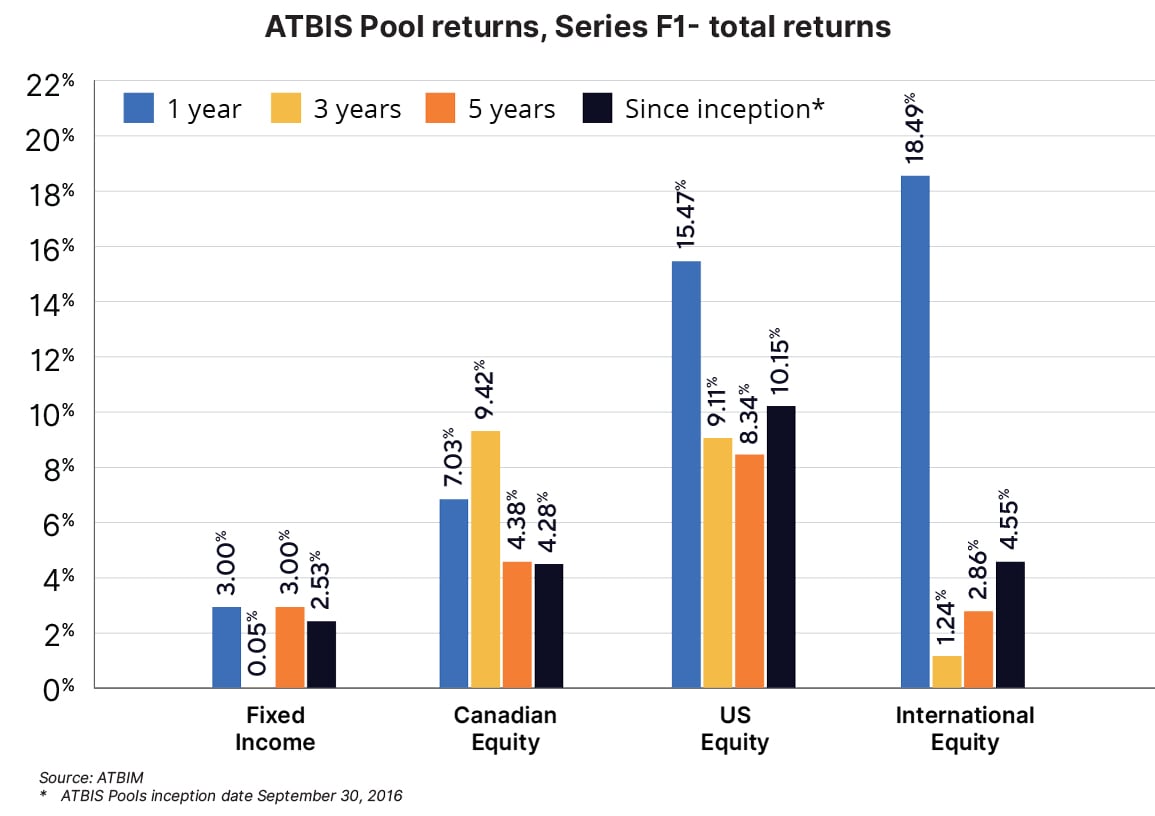
- All ATB Investment Management funds (the Funds) saw negative performance for the quarter. Total returns for the six Compass Portfolios ranged from -1.1% to -2.7%, and the four ATBIS Pools ranged from -0.5% to -2.6%1.
- Inflation in Canada saw core measures stronger than expected across the board, with wages continuing to grow above inflation and labour markets remaining robust, closing the door to rate cuts any time soon.
- Equity and fixed income markets over the quarter were challenging for investors, as both asset classes saw declines from bond yields rising amid expectations of higher for longer interest rates.
Economics
According to Statistics Canada’s quarterly population estimate, Canada’s population grew to 40 million as of July 1. This milestone comes as the country’s population grew 2.9% over the last 12 months—the highest rate since 1957, nearly 98% of that coming from net international migration.
While population growth is generally positive news as it promotes growth and economic activity, it may cause challenges in the Bank of Canada’s (BoC) fight against inflation. Headline inflation rose to 4.0% year-over-year, coupled with persistent core measures that remain above target. Rising shelter costs are cited as a significant issue within the core measure, but taking shelter out of the equation left inflation at 3.2%—therefore shelter alone can’t be blamed for driving inflation. Hourly wages grew 4.9% for August and remain range-bound between 4.0% and 6.0% since June 2022. To stay ahead of inflation, the BoC raised interest rates by 0.25% again in July and suggested they are comfortable with higher rates for longer. As a result, market expectations for rate cuts starting next year in Canada have vanished, and another hike could still be a possibility. Be that as it may, gross domestic product (GDP) in July remained essentially flat. Looking back 12 months, real GDP has grown 1.1%. In the context of a population increasing by 2.9% over the same period, this growth rate raises questions about productivity and per-capita growth that may cloud the rate path forward.
Our neighbours to the south are seeing slightly different trends, as core Personal Consumption Expenditures (PCE)—the Federal Reserve’s (the Fed) preferred measure of inflation—continues to fall, with August coming in at 3.9%. Headline inflation (Consumer Price Index - CPI) however, rose to 3.7% for August, continuing the uptick from July as the base effect from energy continues to detract less. Despite aggressive tightening by the Fed, the US economy has grown at a real annualized rate of at least 2.0% for the previous four quarters, and there are some expectations for slight acceleration into the end of the year. The Fed has also increased its expectations for the US economy and is now forecasting 2.1% growth for 2023 versus 1.0%, as was expected in June. Looking at other data for guidance isn’t as helpful, as the data is more ambiguous than in previous quarters. Forward-looking measures such as the services and manufacturing Purchasing Managers Indices (PMIs) are at odds with each other, and wholesale sales continue to decline on a yearly basis. Consumer measures are also somewhat conflicting as retail sales are increasing while falling short of inflation, but savings rates are below long-term averages, suggesting people are still digging into excess savings to keep themselves afloat.
Internationally, headline inflation continues to moderate, particularly within the UK, where inflation has fallen to 6.7%—still relatively high, but much better than the 11.0% seen in October last year. Despite progress made in most inflation categories, one that remains particularly sticky is food. While food is categorized as a ‘volatile’ component and is removed from core inflation, it is still one of the most visible and painful components for consumers. In the European Union, for example, food price inflation is nearly double (10.3%) the headline number (5.2%), and in most markets it is at least a couple of percent higher than the general measure. Food prices are likely to weigh heavily on consumers and are worth watching especially in the context of other consumer spending. Turning to commodities, oil prices rose 28.0% to $91/barrel over the quarter as OPEC announced an extension in the 1.3 million barrel per day production-cut to the end of the year. The sustainability of these price levels remains to be seen as elevated concerns surrounding Chinese economic growth still abound, and should the economies of developed markets slow, energy prices are unlikely to stay at current levels.
Markets
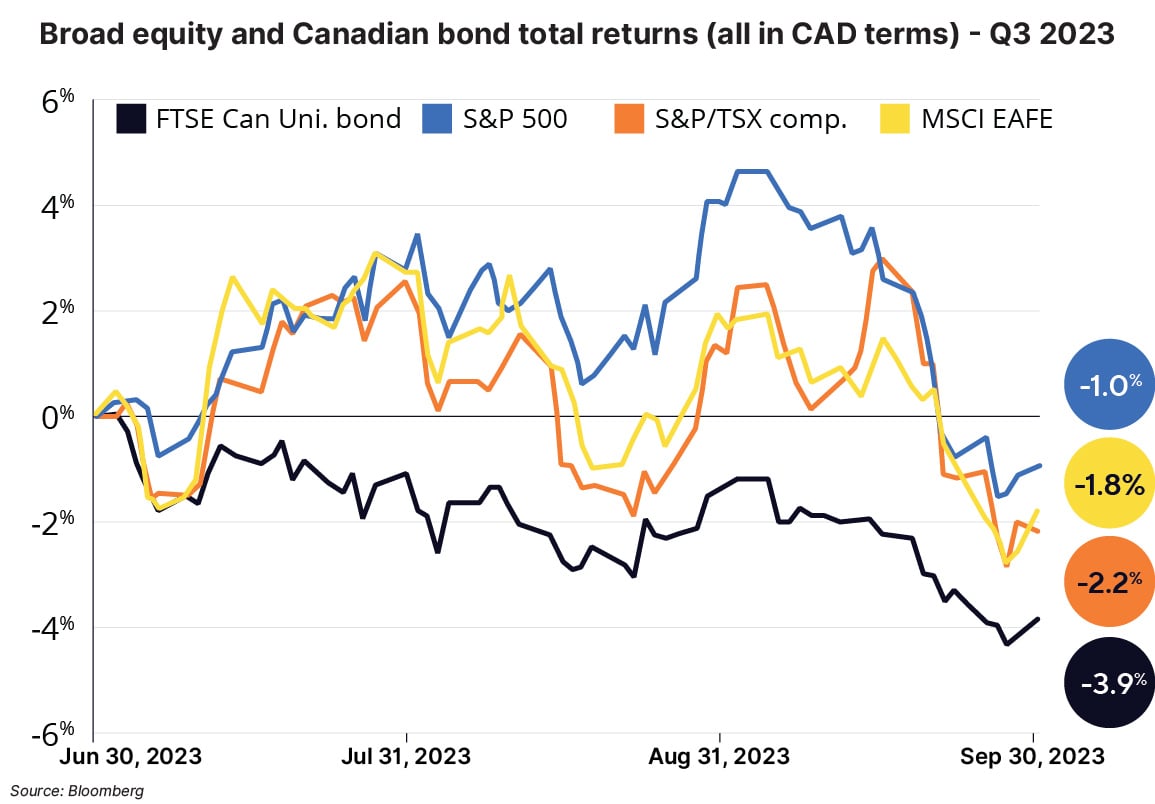
As inflation remains above target and the economy remains relatively resilient, the rate hike over the quarter and expectations shifting to a higher-for-longer mindset have led the average bond yield to move up roughly 0.6% over the quarter to just under 5.0%. This left prices for bonds in Canada declining by 3.9%2 on average. The ATBIS Fixed Income Pool series F1—the Fund with 100% exposure to fixed income—fell 1.0% over the quarter and has maintained a positive return year-to-date. The relatively short duration holdings of the funds fared better from having less interest rate sensitivity as rates rose. In addition, the funds hold a good deal of corporate bonds which benefited from credit spreads declining slightly over the quarter on average for both investment grade and high-yield bonds.
Changes within the bond holdings in the Funds over the quarter followed the theme of increasing credit quality, which has been the trend since the end of 2020. New positions added included Canada federally-backed bonds and a secured AAA bond issued from the Bank of Nova Scotia, which offset sales of relatively lower-rated corporate issues. With the rise in yields, the fixed income portion of the funds (for those with an allocation to fixed income) is priced to yield at about 6.7%-6.9%, depending on the fund.

Broad equity markets declined slightly over the past quarter across Canada, the US, and abroad by 1.0% to 2.2% in Canadian dollar terms as shown in the chart. Company revenues and earnings have continued to see some degree of aggregate growth. International stock earnings have outpaced North America through 2023, growing revenues by roughly 10.0% and earnings by nearly 15.0%3, including growth in Q3. Company valuations based on price-earnings ratios remain mostly attractive versus historical averages, although large-market cap stocks in the US are a possible exception.
Within the US large-cap, a select number of these companies were driven higher by the artificial intelligence (AI) theme. Companies such as Meta, Alphabet, Apple, and Nvidia saw significant price increases in the first half of the year. However, over the last three months, performance for technology and related stocks has been more muted as the market still grapples with what impact AI may ultimately have on company profitability and growth. In a flashback from 2022, the best performing sector was once again energy over the quarter, with the price of crude oil increasing as mentioned earlier.


The Fund’s trimming of equities in favour of fixed income that commenced last quarter continued through July bringing them back to a neutral positioning (fixed income was brought up to each fund's benchmark weight). Relative valuation differences between US and international equities reached a rare historical disparity, leading international stocks to appear to trade at a significant discount. The valuation disconnect led us to sell US equity positions and add to international equity positions throughout July.
Closing remarks
The first half of 2023 had inflation declining, and equities and bonds rising in price. The problems that had surfaced in 2022 were subsiding, and bets on a recession were fading. This last quarter has muddied the waters again to some degree. Inflation is sticking around, leaving central banks with the likely path of higher-for-longer rates on the table. Despite this, the global economy continues to be resilient, with both economic growth and strong employment. We don’t pretend to know where the markets or economy might be next quarter or a year from now, but we are confident that, for patient, long-term investors, bonds and stocks today continue to trade at attractive valuations.
1 Compass Portfolio Total Returns for series A, and ATBIS FI Pool Total Returns for series F1. Fund returns for all series can be found on atbim.atb.com/funds.
2 FTSE Canada Universe Bond Index
3 MSCI EAFE Index Trailing 12 month sales, and earnings via Bloomberg
This report has been prepared by ATB Investment Management Inc. (ATBIM). ATBIM is registered as a Portfolio Manager across various Canadian securities commissions with the Alberta Securities Commission (ASC) being its principal regulator. ATBIM is also registered as an Investment Fund Manager who manages the Compass Portfolios and the ATBIS Pools. ATBIM is a wholly owned subsidiary of ATB Financial and is a licensed user of the registered trademark ATB Wealth.
The performance data provided assumes reinvestment of distributions only and does not take into account sales, redemption, distribution or optional charges or income taxes payable by any security holder that may reduce returns. Unit values of mutual funds will fluctuate and past performance may not be repeated. Mutual Funds are not insured by the Canada Deposit Insurance Corporation, nor guaranteed by ATBIM, ATB Securities Inc. (ATBSI), ATB Financial, the province of Alberta, any other government or any government agency. Commissions, trailing commissions, management fees, and expenses may all be associated with mutual fund investments. Read the fund offering documents provided before investing. The Compass Portfolios includes investments in other mutual funds. Information on these mutual funds, including the prospectus, is available on the internet at www.sedar.com.
Past performance is not indicative of future results. Opinions, estimates, and projections contained herein are subject to change without notice and ATBIM does not undertake to provide updated information should a change occur. This information has been compiled or arrived at from sources believed reliable but no representation or warranty, expressed or implied, is made as to their accuracy or completeness. ATB Financial, ATBIM and ATBSI do not accept any liability whatsoever for any losses arising from the use of this report or its contents.
This report is not, and should not be construed as an offer to sell or a solicitation of an offer to buy any investment. This report may not be reproduced in whole or in part; referred to in any manner whatsoever; nor may the information, opinions, and conclusions contained herein be referred to without the prior written consent of ATBIM.
