Portfolio managers' commentary
2024 year in review
Equity and fixed income markets delivered another stellar year, and ATB Investment Management funds saw positive overall performance for 2024. 2025 brings heightened policy risks.

Summary
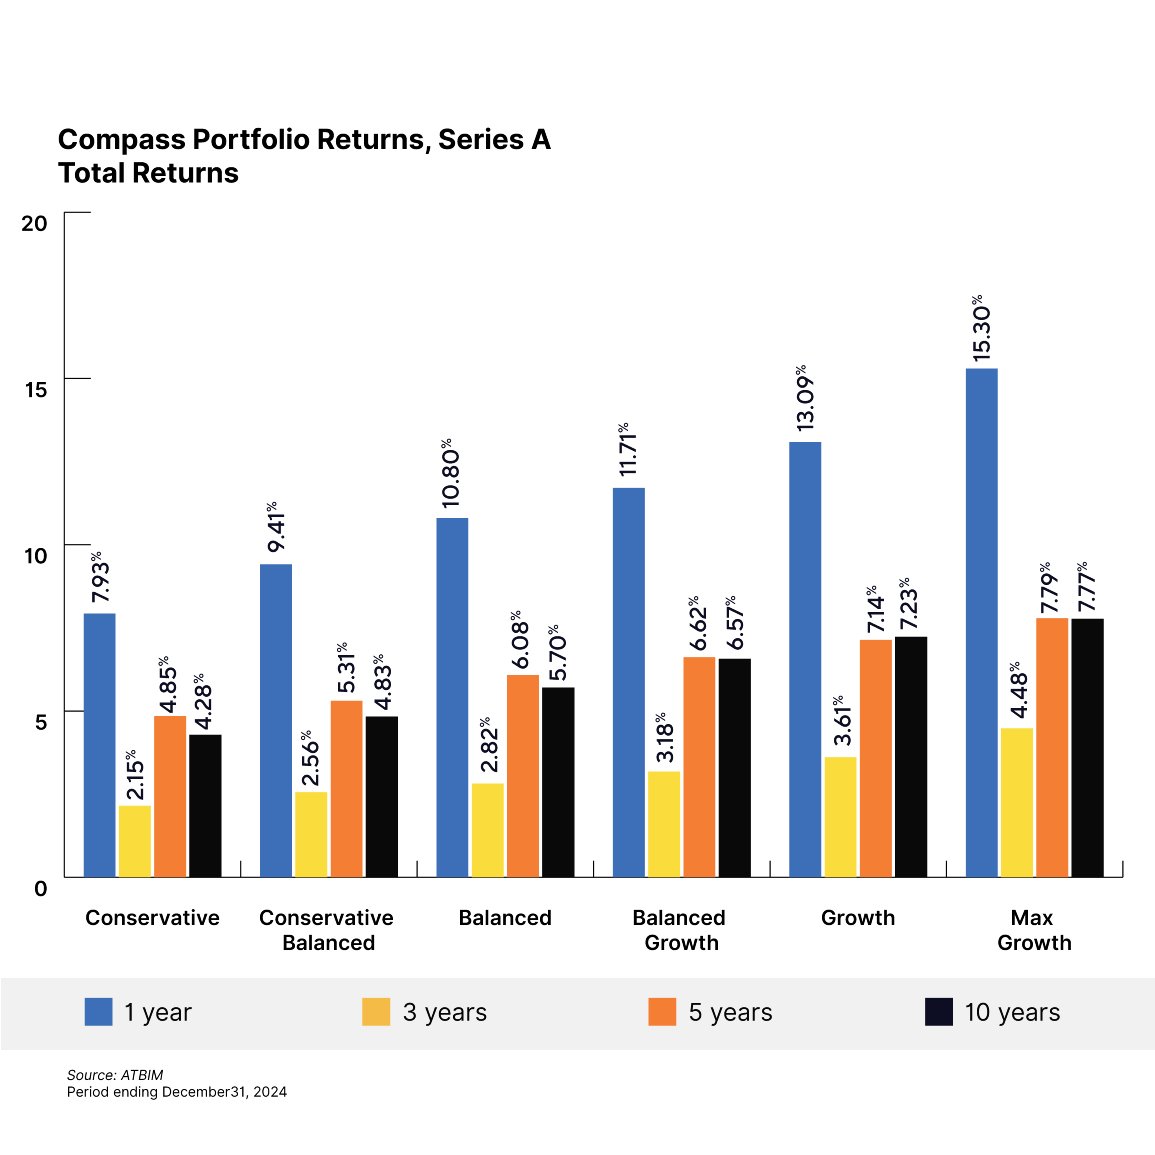
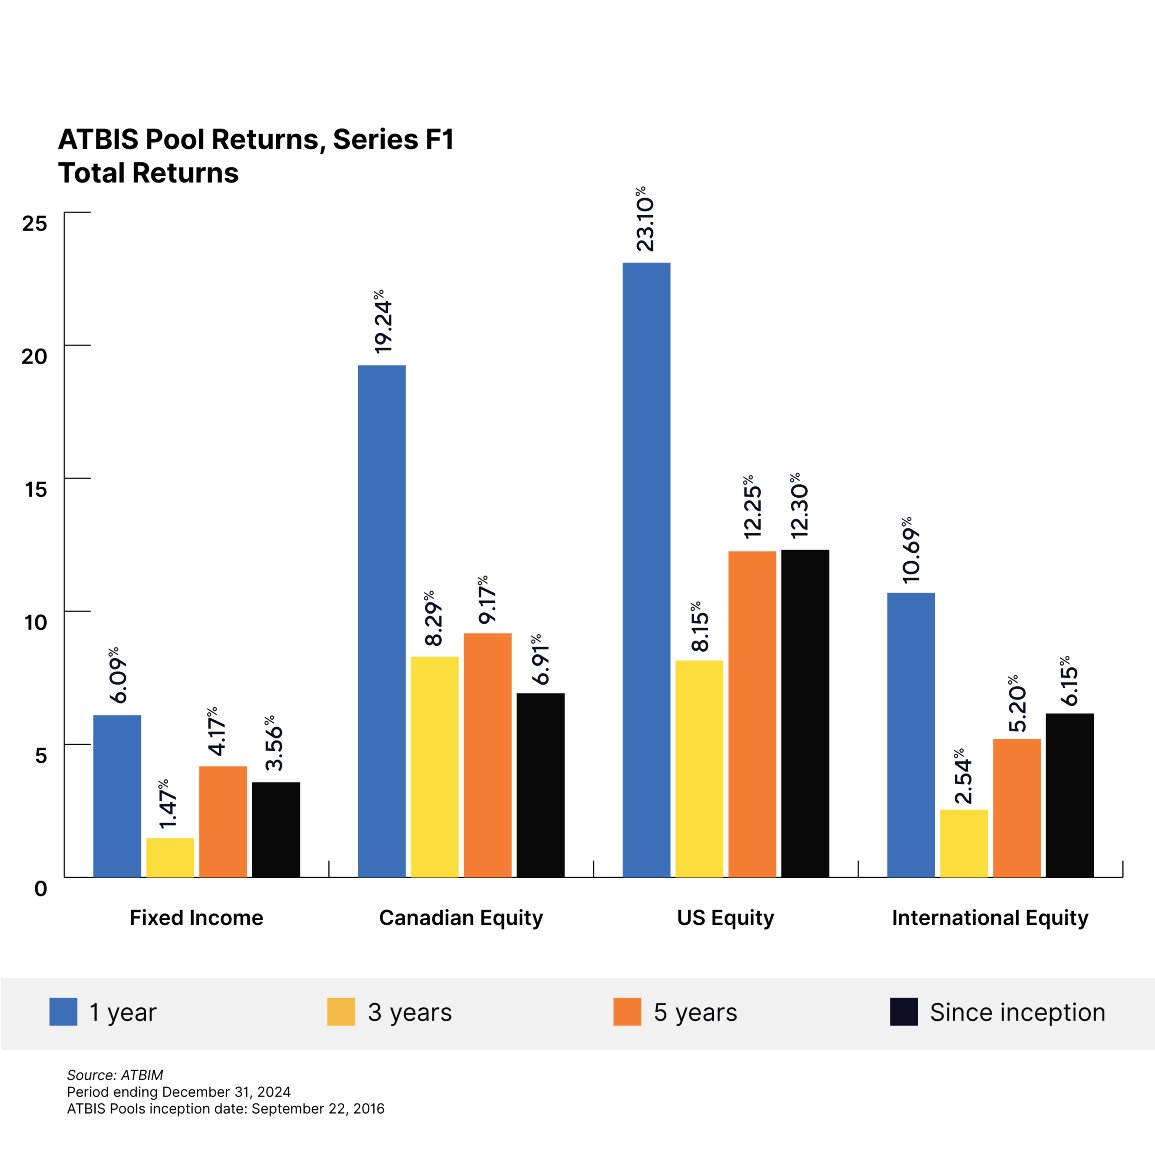
- All ATB Investment Management funds (the Funds) saw positive overall performance for 2024. For the full year, total returns for the six Compass Portfolios ranged from 7.9% to 15.3%, and the four ATBIS Pools ranged from 6.1% to 23.1%1.
- Equity and fixed income markets delivered another stellar year to investors, with major equity markets fully recovering their 2022 losses. Bonds in Canada overall have yet to completely recover from the dramatic rise in interest rates, but are within 3% of treading above water.
- Policy risk is heightened for 2025 despite a Republican sweep within the US Congressional assembly, as a Trump presidency already has trading partners concerned over threats of overarching tariffs on goods.
Economics
The past year marked the start of this rate cycle’s ‘easing’ phase, as central banks in most developed economies started to cut key policy rates. Inflation has started to fall or has reached desired target ranges in many cases, such as within Canada. The next task (and probably most difficult) is to hit the terminal rate—the rate at which inflation will remain under control without limiting economic growth.
The Bank of Canada (BoC) was the first major central bank to lower its key policy rate, notably ahead of its US counterpart. The BoC began with a 0.25% cut in June and continued to reduce the rate throughout the year. The sum of the cuts eventually totalled 1.75% and the year ended with an overnight rate of 3.25%. The US Federal Reserve (Fed) started at a higher rate (5.5%) and commenced cutting rates in September. It has only reduced the rate by 1%. Part of the reason is that the fight against inflation in Canada reached its goal ahead of the US, with headline inflation reaching 1.6% by the end of September. Core measures of inflation have also fallen within the target range but remain above 2%. Subtracting mortgage interest costs leaves headline inflation at or below 2.1% for all of 2024, with the most recent figure coming in at a mere 1.3%, showcasing the outsized effect of this shelter component on inflation. The economy itself was a contributing factor to the cuts. While generally speaking, GDP has been growing this year, per capita GDP has been falling, as economic growth has not kept pace with the fastest-growing population in decades. While the Canadian economy isn’t growing at quite the pace the US is, it is growing at a similar rate to its European and Japanese peers.
Globally, the US continues to be the driver of economic growth, far outpacing its developed peers. What’s surprising is not that the US is ahead, but rather the pace at which it keeps growing. The most recent two quarters saw at least 2.7% to 3% growth year-over-year, compared to the G8 average of approximately 2.2%. Inflation is also higher in the US with the headline rate falling to 2.7% in November and core inflation remaining above 3% throughout the year. Given the Fed’s dual mandate of price stability and full employment, it’s not surprising that the Fed is behind its Canadian counterpart.

Equities
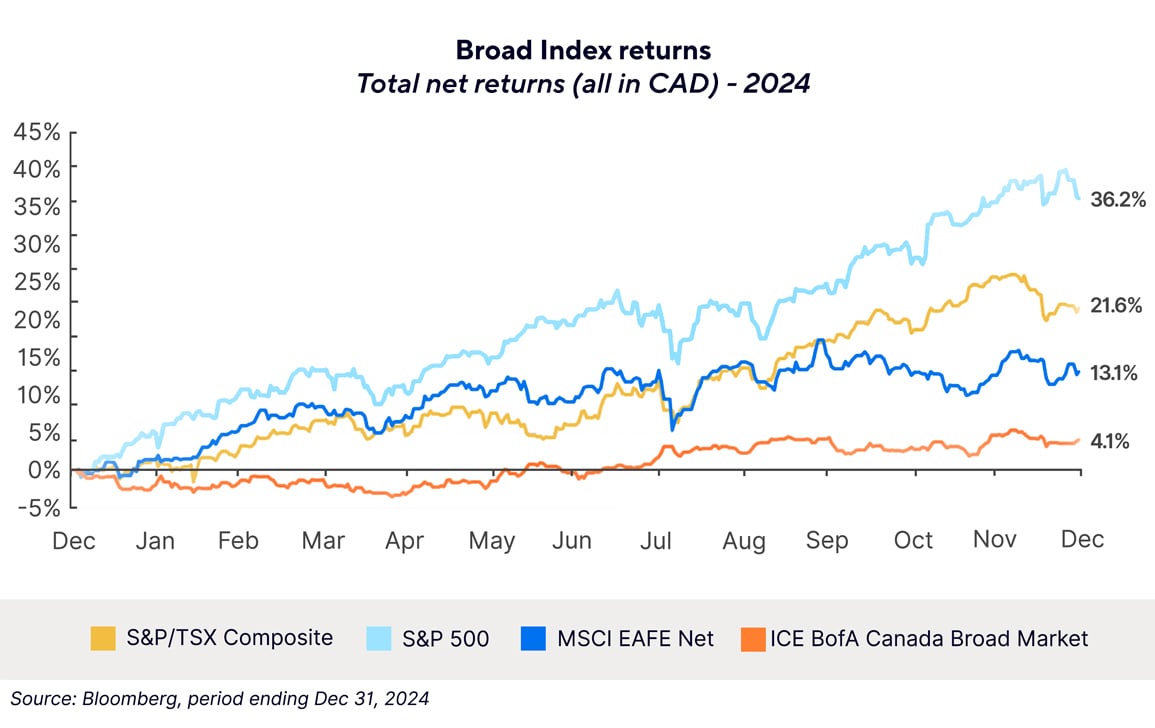
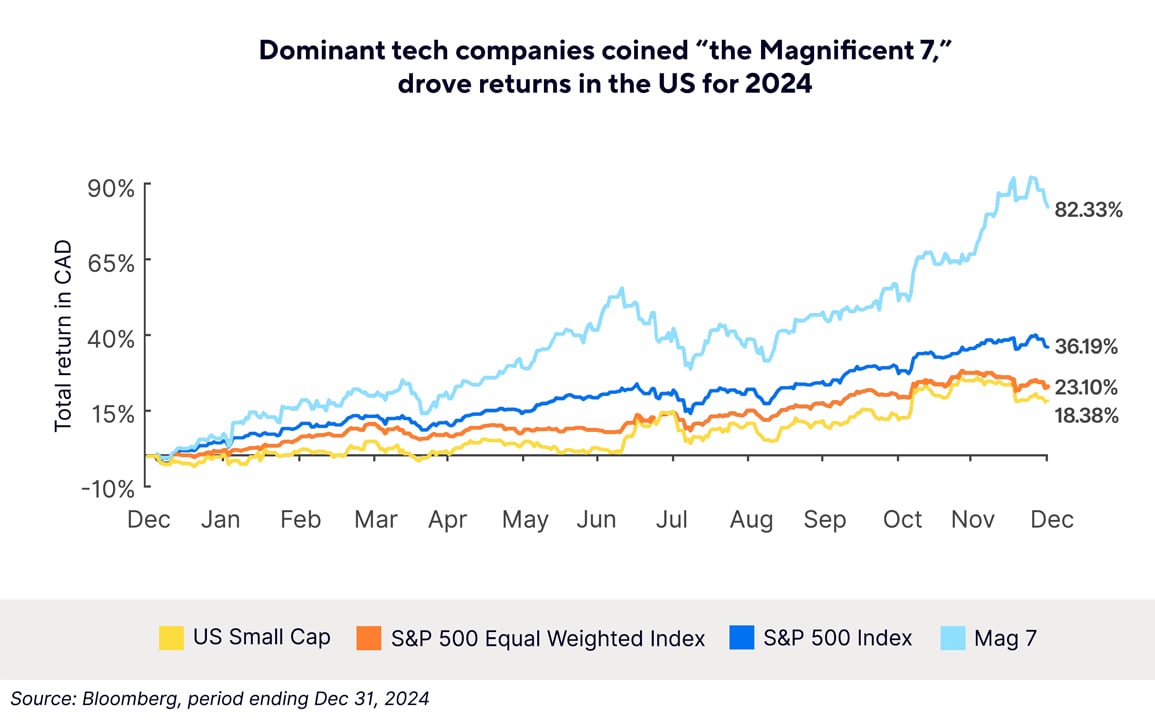
After coming off of a great 2023, both equity and fixed income markets in North America had another standout year in 2024. This was especially true in the US, where the S&P 500 rose more than 36% in Canadian dollar terms. The performance, however, was concentrated within a few names, dubbed the ‘magnificent seven,’ which are Tesla, Amazon, Alphabet (Google), Meta (Facebook), Apple, Microsoft and Nvidia. These seven names rose more than 82% on a Canadian dollar basis, accounting for almost half of the S&P 500’s performance over the year. Comparing the capitalization-weighted to the equal-weighted index, which returned just over 23%, shows the outsized impact of the top-weighted stocks on performance.
While the performance of the magnificent seven has been outstanding, Nvidia, in particular, has benefitted from the rise of the AI craze that has taken hold of the market. There are undoubtedly other benefactors of the AI-driven push—such as Microsoft and Alphabet—but the significant investment into AI-related infrastructure pushed Nvidia to rise over 195% in 2024 in Canadian dollar terms and contribute more than 6% to the S&P 500’s performance. The latter part of the year saw some broadening of performance as rate cuts lower the cost of borrowing using floating rate debt—something smaller companies tend to use to finance their growth or operations. This was a benefit for the portfolio as the holdings are overweight small- and mid-cap stocks compared to the benchmark, but was not enough to make up for the outsized impact of tech.

Even though the economic outlook isn’t as rosy in Canada compared to the US, that didn’t stop Canadian equities from rising double digits in 2024. Unlike the US, performance was more broad-based, although financials and energy stocks led the pack. Small-cap Canadian stocks didn’t have a reckoning mid-year like they did in the US either, as small-cap companies in Canada tend to be focused on the energy and materials sectors. They did keep up throughout the year with their large-cap counterparts thanks to rising precious metal prices along with oil prices that were more or less rangebound throughout the year.
Equity markets in other parts of the world also did well, although Japan caused a stir in markets when the Bank of Japan raised its policy rate in late July. This likely led to the unwinding of carry trades held by investors, and saw the Nikkei drop over 17% in JPY terms within a week. Losses spilled over to the rest of the world’s equity markets but recovered by the end of August. China also saw some turbulence as policymakers announced stimulus, sending the MSCI China index rising more than 34% in two weeks in USD terms. The euphoria around the announcement faded as details regarding the stimulus failed to meet investor expectations, but Chinese markets still rose just under 20% by year-end. Europe was the laggard in the developed world rising just over 2% for the year, although it didn’t have any wild swings like its peers rising at most 12% at one point.
On a global basis, earnings continue to grow, with the US leading the pack in terms of growth. Even though the S&P 500 has seen a 7.7% increase in earnings, the appreciation in stock prices has made US stocks even more expensive on a valuation basis, especially compared with their global alternatives. Earnings only grew approximately 3.5% using the equal weighted index, highlighting the concentration risk of the US index that has emerged and continues to grow.
Fixed Income
Canadian bond yields were slightly volatile over the year, as the timing of the BoC’s first rate cut was put into question earlier in the year amid concern over lingering inflationary pressures. Yields initially rose in the first quarter of 2024. They started to fall by the end of May as it was clear that consistent progress had been made against rising price levels, ultimately falling overall on a year-over-year basis by the end of December.
In a ‘normal’ scenario, falling bond yields benefit bonds with longer maturities due to their higher sensitivity towards interest rates. However, over the past year, yields on bonds with shorter maturities have fallen around 0.86%2, but yields on bonds with longer maturities have risen by 0.16%3. This twist in the yield curve has resulted in shorter bonds performing better than longer bonds despite an overall drop in yields. Shorter bonds returned 5.7% over 2024, versus longer bonds only returning 1.35%. As longer-term inflation and growth expectations are key drivers of mid- to long-term bond yields, it’s likely that market participants feel that the BoC has a better handle on inflation and is determined to keep it near the 2% target, pushing longer bond yields higher.
Corporate bonds were also a benefactor of both the movement of the yield curve and corporate bond spread tightening over the year. These bonds typically have a shorter duration but are also more concentrated in the short- and mid-part of the curve, further benefitting from the twist in yields. The result was outperformance compared to their government counterparts in all segments of the bond universe.
Closing remarks
In summary:
- 2024 was a stellar year for equities, led by the continued strength in US markets. Indeed, back-to-back years of over 20% returns in the S&P 500 (in USD terms) is a feat not seen since the late 1990s! Will this impressive performance continue in 2025, or will we see more modest returns?
- In fixed income, Canadian bonds have also had an interesting year, with short and long bond yields moving in different directions. This raises questions about the shape of the yield curve in 2025.
- Politically, there is a degree of “wait-and-see” for both the US and Canada. The new Trump administration—which takes office on January 20, 2025—and a federal election in Canada later this year could bring significant policy shifts.
The US has an interesting situation regarding its economy with resilient growth and employment numbers coupled with inflation measures hovering around 3%. As a result, we’re seeing a slower pace of interest rate cuts compared with Canada, as the Fed aims to prevent inflation from rising again.
In Canada, with inflation back at the desired 2% target, discussions centre on the potential impact of Trump’s proposed 25% tariff on Canadian exports to the US. If implemented, this tariff could lead to higher inflation and reduced economic growth. With Trump, however, the operative word is “if”.
There are many more questions including:
- will the AI-driven equity rally continue?
- will performance be driven by other sectors?
- will bond yields move in line with interest rates?
With so many unknowns this year, a diversified investment approach remains prudent. Staying invested and maintaining a balanced portfolio is key to navigating the year ahead.


1 Compass Portfolio Total Returns for series A, and ATBIS FI Pool Total Returns for series F1
2 As measured by the yield of the FTSE Russell Canada Universe Short Term Bond Index
3 As measured by the yield of the FTSE Russell Canada Universe Long Term Bond Index
This report has been prepared by ATB Investment Management Inc. (ATBIM). ATBIM is registered as a Portfolio Manager across various Canadian securities commissions with the Alberta Securities Commission (ASC) being its principal regulator. ATBIM is also registered as an Investment Fund Manager who manages the ATB Funds, Compass Portfolios and the ATBIS Pools. ATBIM is a wholly owned subsidiary of ATB Financial and is a licensed user of the registered trademark ATB Wealth.
The performance data provided assumes reinvestment of distributions only and does not take into account sales, redemption, distribution or optional charges or income taxes payable by any security holder that may reduce returns. Unit values of mutual funds will fluctuate and past performance may not be repeated.
Mutual Funds are not insured by the Canada Deposit Insurance Corporation, nor guaranteed by ATBIM, ATB Securities Inc. (ATBSI), ATB Financial, the province of Alberta, any other government or any government agency. Commissions, trailing commissions, management fees, and expenses may all be associated with mutual fund investments. Read the fund offering documents provided before investing. The ATB Funds, Compass Portfolios, and ATBIS Pools include investments in other mutual funds. Information on these mutual funds, including the prospectus, is available on the internet at www.sedarplus.ca.
Past performance is not indicative of future results. Opinions, estimates, and projections contained herein are subject to change without notice and ATBIM does not undertake to provide updated information should a change occur. This information has been compiled or arrived at from sources believed reliable but no representation or warranty, expressed or implied, is made as to their accuracy or completeness. ATB Financial, ATBIM and ATBSI do not accept any liability whatsoever for any losses arising from the use of this report or its contents.
This report is not, and should not be construed as an offer to sell or a solicitation of an offer to buy any investment. This report may not be reproduced in whole or in part; referred to in any manner whatsoever; nor may the information, opinions, and conclusions contained herein be referred to without the prior written consent of ATBIM.
